


New here? Join The Mobility Signal for on-the-ground intelligence from Southeast Asia’s automotive and mobility markets, built for industry leaders, investors, private equity, venture capital and advisors who need to understand what is changing and what it means.
Market Scale & Structure
Philippine new-vehicle sales have traditionally been a difficult area to measure and interpret accurately, with various automotive data bodies, different methods of classification and certain automotive brands not participating in any of the official groups, like CAMPI, AVID or TMA.
What we want to do with this data is not just report as it is given, but piece together fragmented information, move data around where necessary to make economic sense, and identify the real trends. Doing this provides a stronger foundation for building future forecasts.
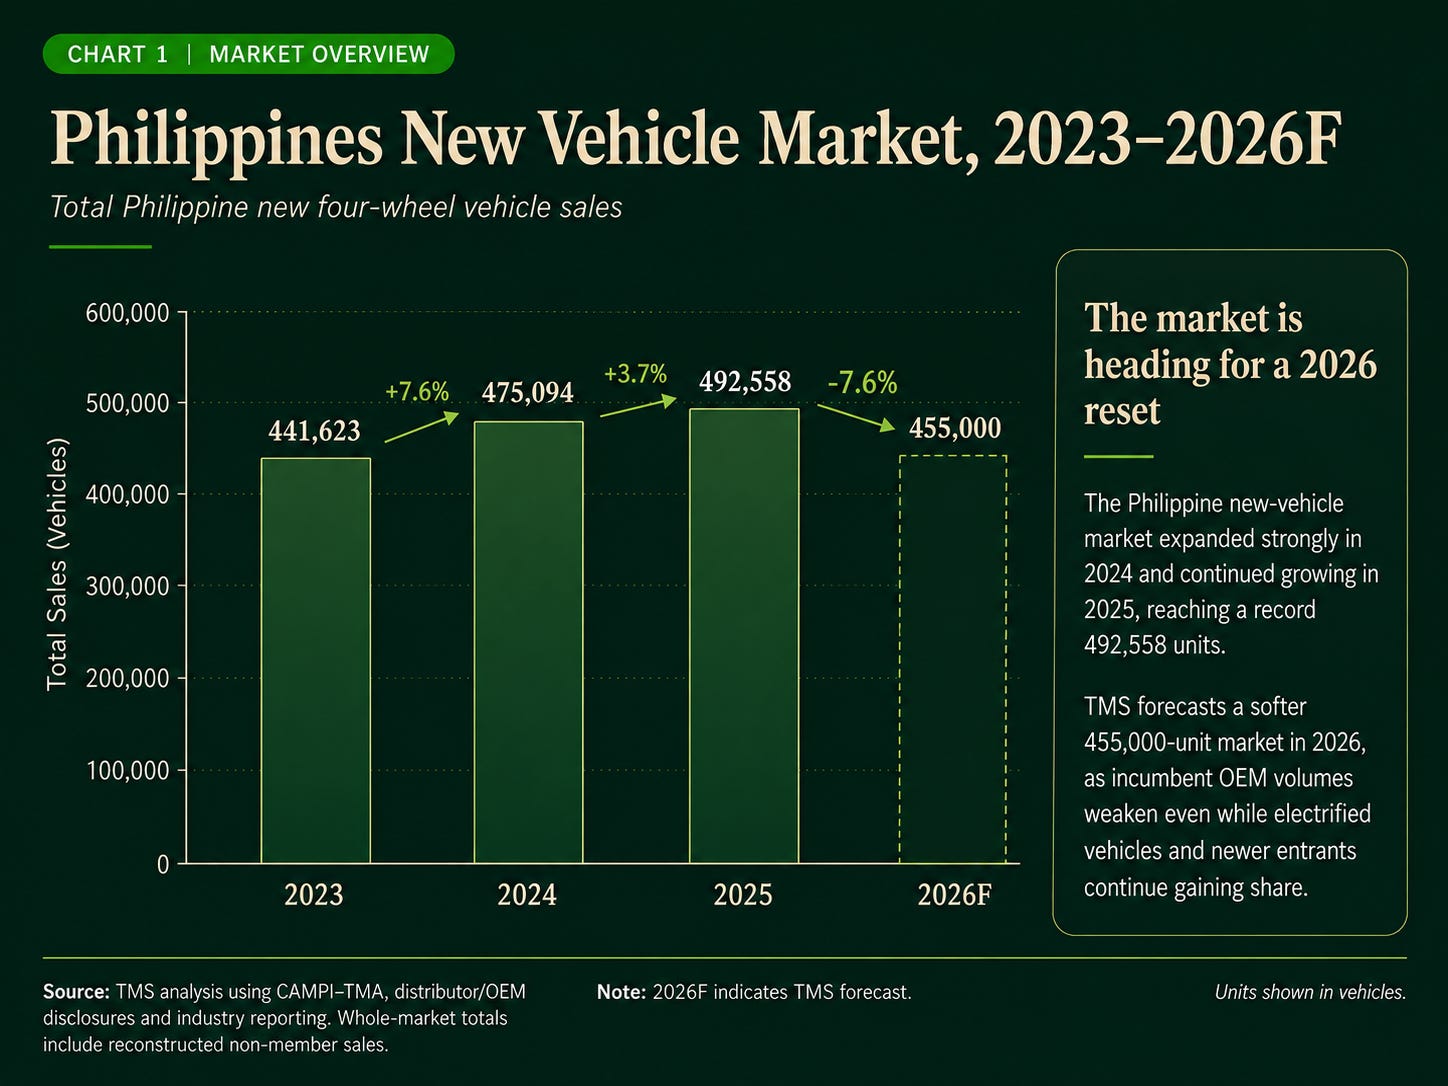
To calculate new vehicle sales from 2023 to 2026, we collected data from CAMPI-TMA, AVID, brand websites and PR releases, automotive websites and government sources like the LTO. We then reconciled these different sources to determine what we believe is the best estimate for each year and to build our 2026 forecast.
From 2023 to 2025 there was a cumulative growth of 11.5% in automotive sales, predominantly driven by core Japanese brands such as Toyota, Mitsubishi, Suzuki, Honda and Isuzu. However in 2025 Chinese brands really stepped up, specifically BYD, which broke into third place with over 26,000 vehicle sales. This has accelerated further into H1 2026, when 40% of the top 20 brands were of Chinese origin, while Japanese brands showed year-on-year sales declines, ranging from 9% to 42% over the same time period.
The Passenger-versus-commercial split was one of the biggest areas we wanted to tackle. The key question was how much of the market is actually dedicated commercial use, how much consists of passenger vehicles being used for fleet or other commercial activities, and how much is genuinely private passenger use.
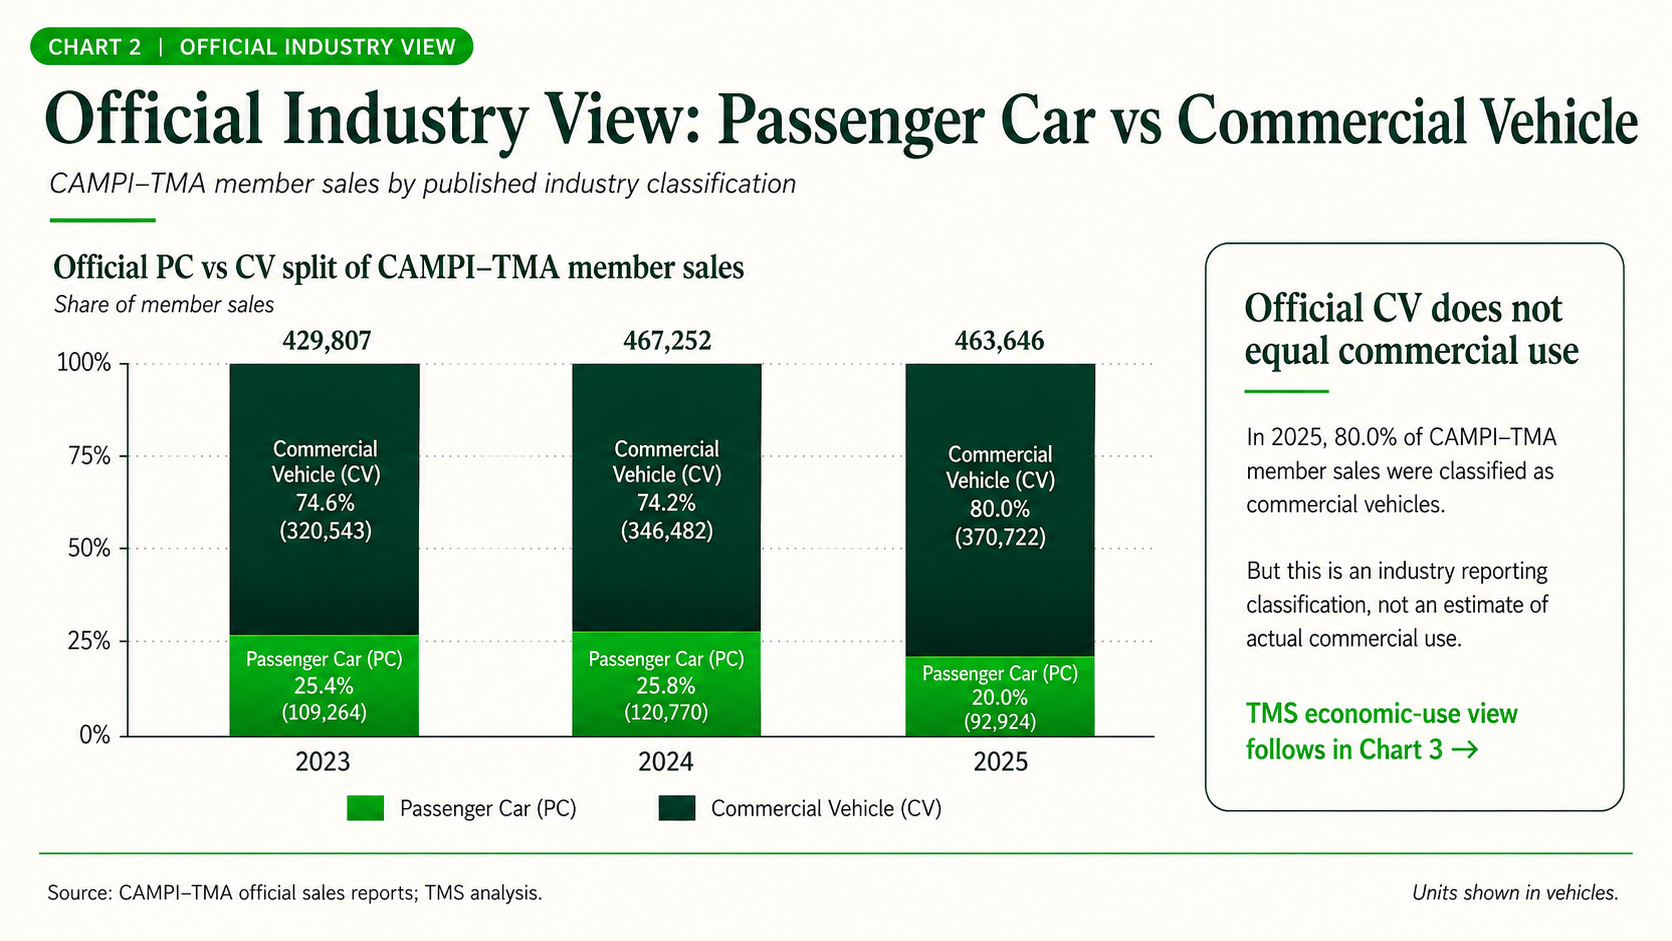
At face value, the industry classifications suggest that around 75-80% of vehicles sold in the Philippines sit within the commercial vehicle segment. But this does not tell the true economic story of how vehicles are actually used.
CAMPI–TMA classifies approximately four out of five vehicles sold by its members as commercial vehicles. However, this is an industry reporting classification rather than a measure of economic use. The CV category includes pickups, SUVs, MPVs/AUVs and vans that are frequently purchased for household or passenger use.
TMS therefore treats the official PC/CV split as a reported classification and separately estimates actual commercial use in Chart 3. Non-member sales are excluded from this PC/CV chart rather than being assigned to categories, where no official classification exists.
The first question we wanted to tackle was how to identify a credible dedicated commercial vehicle segment, vehicles that are predominantly designed and used for commercial use. This would include trucks, buses, light utility vehicles and specific pickup variants that are mainly used for commercial purposes.
Secondly, we needed to estimate how many passenger vehicles are also being used for commercial activities. Examples would include a Toyota Vios used for taxi or TNVS services or a Toyota Avanza used within a company or government fleet.
So we had some work to understand where the economic use was really being attributed within this mixed commercial vehicle segment.
TMS Methodology
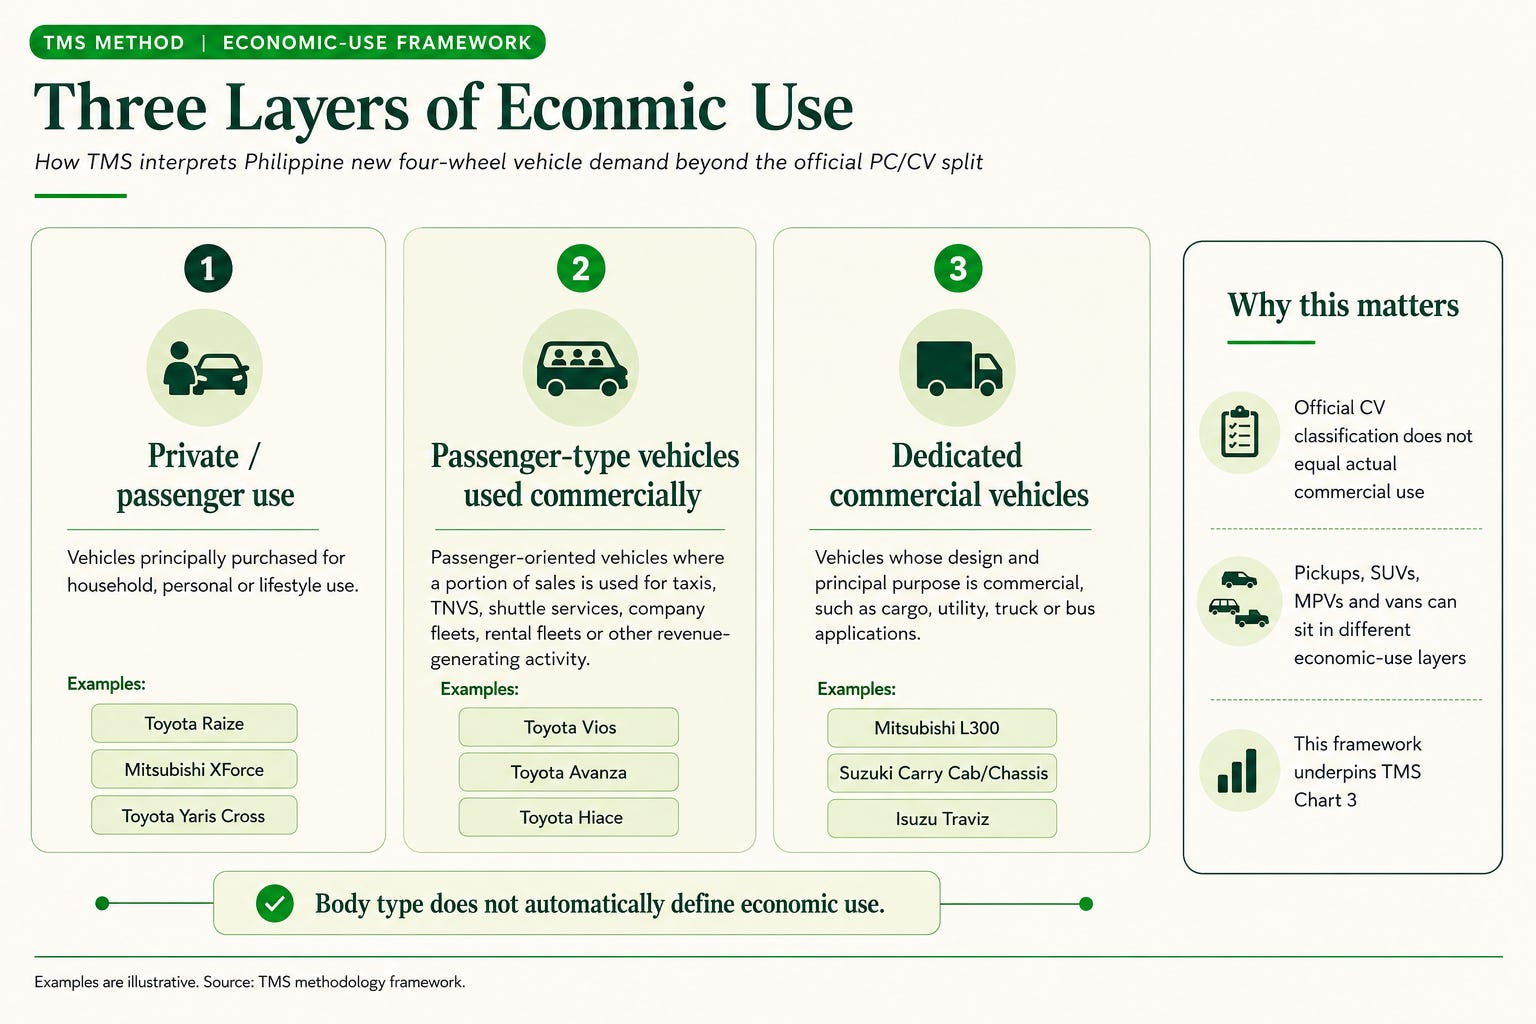
The starting premise was that there are really three economic-use layers, not two. The framework below shows how TMS separates private/passenger use, passenger-type vehicles used commercially and dedicated commercial vehicles.
This distinction matters because a Hilux, Innova, Hiace or Vios can be commercially operated without being a dedicated commercial vehicle, while an L300, Carry cab/chassis or medium-duty truck is fundamentally commercial regardless of who owns it.
Once we apply this economic-use framework across the whole market, the picture changes substantially.
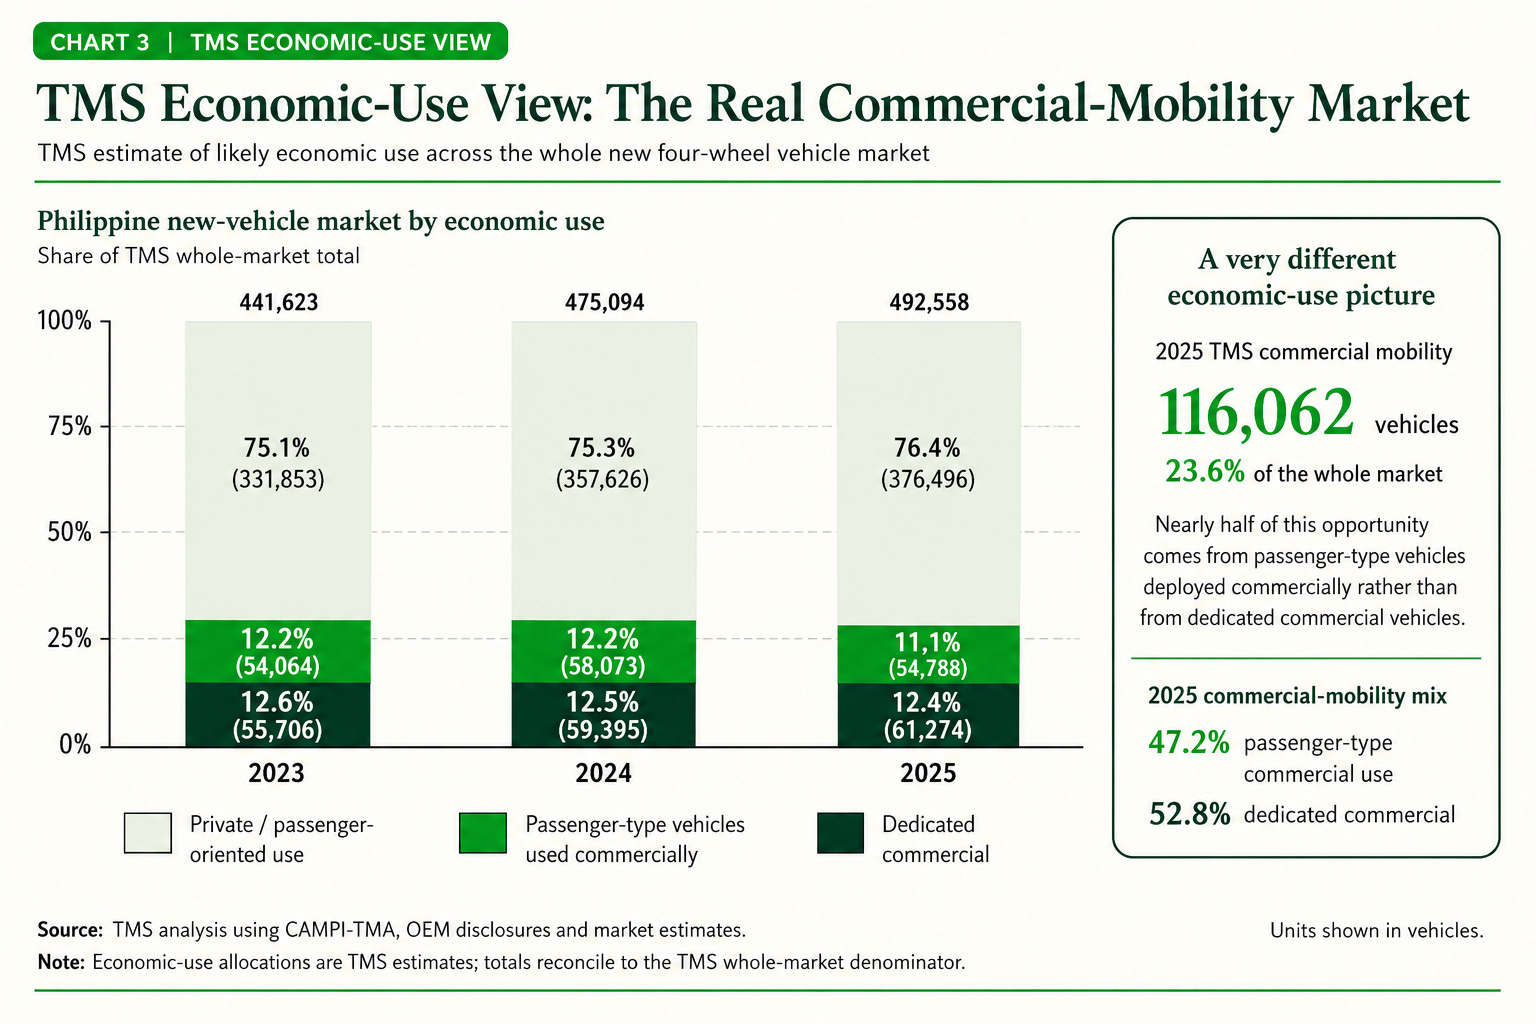
As you can see from the chart, TMS estimates that around 23.6% of the Philippine new-vehicle market was used for commercial activities in 2025, compared with the 80% classified as commercial vehicles in the official CAMPI-TMA view. This is a very different picture.
Of the estimated 116,062 vehicles used commercially in 2025, around 52.8% were dedicated commercial vehicles, while 47.2% were passenger-type vehicles being used for commercial activities. That leaves approximately 76.4% of the whole new-vehicle market attributed to private/passenger use.
The important point is that the official CV classification and actual commercial use are answering two different questions. One tells us how the industry classifies a vehicle; the other tries to estimate what that vehicle is actually being used for.
The decline in passenger-type vehicles used commercially, from 58,073 units in 2024 to 54,788 in 2025, should not necessarily be interpreted as a broad decline in commercial mobility. Some of this may reflect disruptions in the types of vehicles traditionally used for commercial activities, notably legacy sedans and pickups, while commercial mobility itself starts to shift towards MPVs, vans, newer electrified vehicles and dedicated commercial models.
This gives us quite a different view from the conventional classification of passenger and commercial vehicles. The chart also shows that the majority of market growth is currently coming from passenger use, while growth in commercial use has been more modest.
How we built the estimates
The 23.6% commercial-use estimate is not taken directly from any single Philippine database. There isn't one. Instead, we reconstructed the market from the bottom up and used registration and transport data to calibrate the assumptions.
Our calculation was:
Passenger-type commercial use = Σ(model sales × TMS estimated commercial-use share)
and:
Private/passenger use = whole market − dedicated commercial − passenger-type commercial use
We then worked through the market model by model.
Our detailed steps
We reconstructed the four-wheel sales database, using CAMPI-TMA as our base, then reconciled brands/distributors that were not represented using PADA/AVID information, OEM disclosures, independent-distributor reporting and industry reporting.
We built a model-level sales master file, with each brand and model assigned a body type and an economic classification. Sedans/hatchbacks, SUVs/crossovers, MPV/AUVs, pickups and passenger vans initially sit in the passenger-oriented universe. Cargo vans, cab/chassis, workhorse utility vehicles, light trucks, medium/heavy trucks, buses and dedicated/special-purpose products sit in dedicated commercial.
Next, we calculated dedicated commercial from the bottom up. This was one of the more robust parts of the exercise, because the vehicle’s physical purpose gave us a strong classification signal. The working 2025 audit, for example, included products such as Toyota Tamaraw, Toyota Lite Ace commercial variants, Mitsubishi L300, Suzuki Carry, Isuzu Traviz, Kia K2500 and dedicated Foton utility products, together with TMA Category III, IV and V truck/bus volumes. Those model/category estimates reconcile to the 61,274 dedicated-commercial units used in the final 2025 view.
We did not call pickups, vans and MPVs ‘‘Commercial’’. This was an important step away from traditional industry classification. Pickups such as Hilux, Ranger, Triton, Navara and D-Max remained passenger-oriented at the structural classification level. Similarly, passenger vans such as Hiace/Urvan/Staria were not simply pushed wholesale into dedicated commercial. Instead their likely business/fleet portion was determined at variant level, and captured in the second layer - passenger-type vehicles used commercially.
We then estimated commercial use model by model, applying central commercial-use assumptions to models whose Philippine usage clearly crosses over both personal and business use. An example would be the Isuzu D-Max from 2023-2025 where we applied a commercial use share of 30%, 30% and 27.5% respectively.
Finally, we used registrations and transport data to calibrate and improve our assumptions. There is no Philippine database that tells us, for every newly sold vehicle, “this one was bought privately” versus “this one will be used commercially.” So we used registration and transport datasets as reality checks around the model-level assumptions rather than pretending that they directly provide annual new-sales end use.
LTO-derived registration database published through PSA
This enabled us to view vehicle type and ownership classifications, along with other characteristics. This was useful for understanding the installed base and the relationship between private and for-hire/commercial ownership.
LTFRB classifications and published information on taxis, TNVS, PUV/shuttle and other franchised transport
We used this to give us a contextual check on where commercially operated passenger vehicles sit in the market. Again, that was calibration rather than a direct database feed into the 54,064 / 58,073 / 54,788 figures, because LTFRB does not capture every company fleet, rental vehicle, tourism vehicle or commercially operated pickup.
We call these our TMS economic-use estimates. They are not perfect, but the aim is to give more context around economic use, and, hopefully, provide a more useful picture of how vehicles are actually being used across the Philippine market.
Moving into the next chart, we look at the overall market and what types of vehicles Filipinos are increasingly choosing to buy.
The Market by Body Type
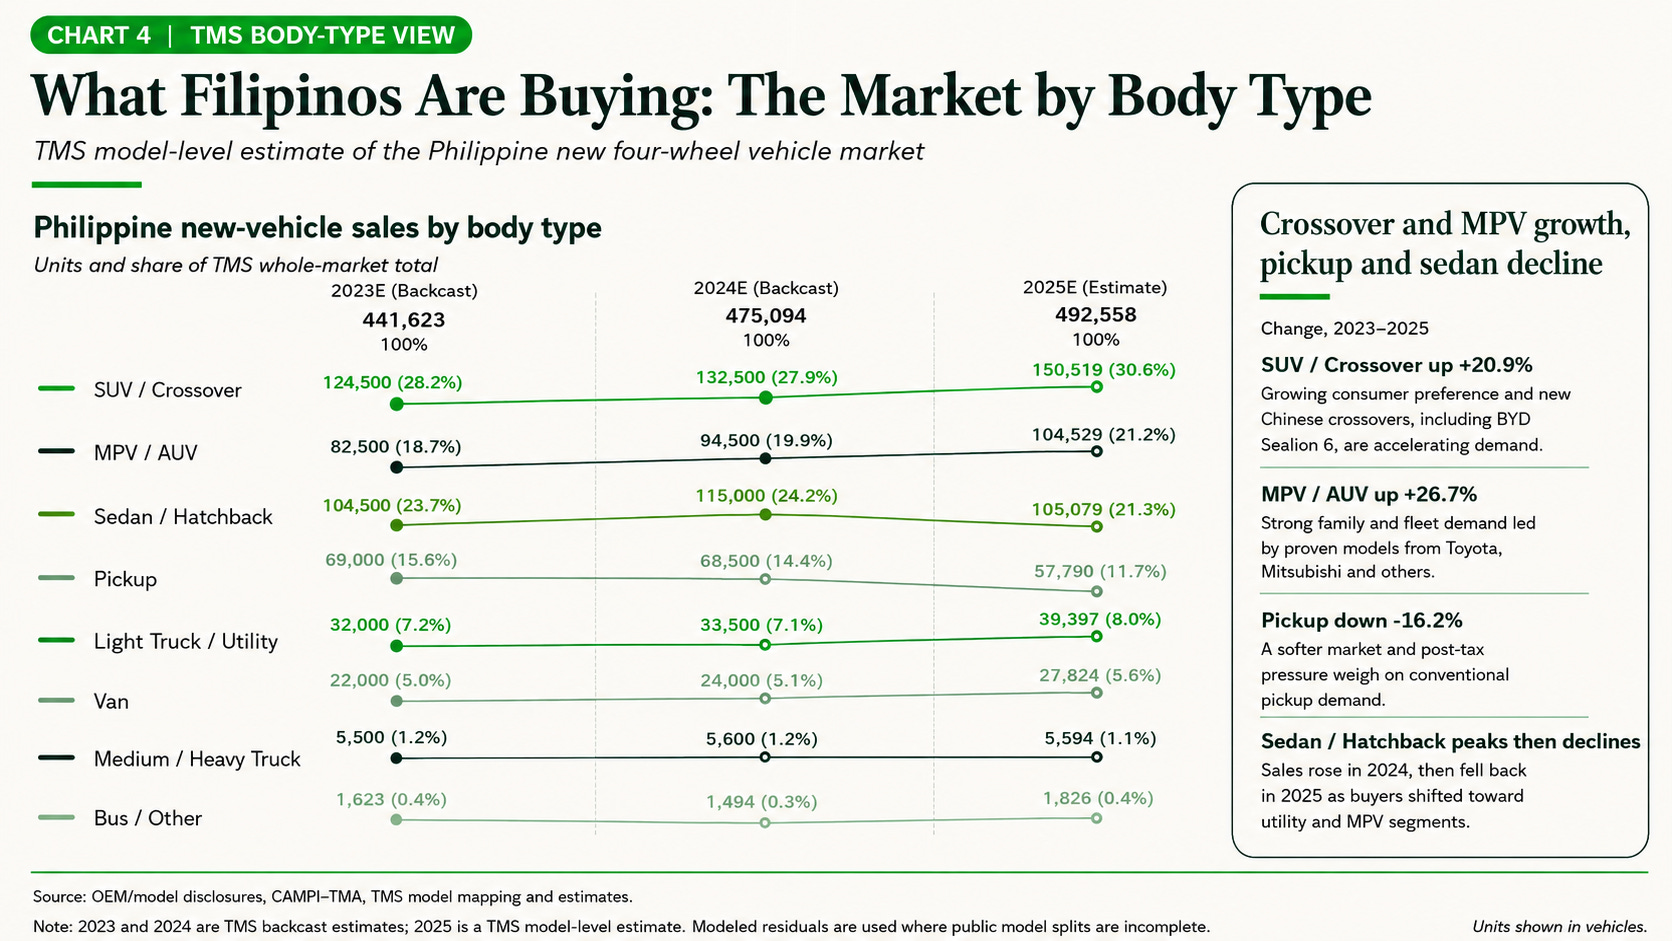
Not surprisingly the growth came from the SUV & Crossovers, followed by the MPV/AUV segment, which is also where some of the biggest technology shifts have been taking place. Chinese brands have pushed hard into these segments with electrified powertrains at attractive price points. Key examples include the BYD Sealion 6, while MG has expanded through its HS hybrids and more recently the G50 PHEV. Toyota has also been electrifying these segments, mainly through the Yaris Cross and the Zenix.
The sedan/hatchback segment is an interesting one because, even though its overall total declined by around 10,000 units, there are some interesting narratives sitting behind those numbers. In 2024, fleet, TNVS and taxi demand was relatively strong, reflected in sales of 43,636 Toyota Vios and 26,313 Mitsubishi Mirage G4 units. In 2025, those numbers fell to 27,811 for the Vios and 17,757 for the Mirage G4, a combined loss of 24,381 units from these two models alone.
In April 2024, LTFRB suspended the planned issuance of 10,000 additional TNVS slots, which may have weakened demand for vehicles such as the Vios and Mirage G4 moving into 2025, but it can’t explain the full decline.
A structural change in the fleet and taxi market was also starting to take shape as operators began electrifying their fleets. One example was the regional partnership between BYD and Grab, aimed at giving Grab fleet partners access to as many as 50,000 BYD vehicles at preferential rates. By June 2025, the Philippine market was also seeing new fully electric taxi fleets, including Grab's EV Taxi Corp partnership and Green GSM's VinFast-based taxi operation.
The other major factor appears to be that more Filipinos are choosing to get more vehicle for their money by moving into the MPV/AUV segment, which grew by around 10.6% in 2025 and more than 26% between 2023 and 2025. Models such as the Avanza, Xpander, Veloz and Raize, together with newer electrified Chinese alternatives, are giving buyers more space and practicality at increasingly competitive price points. So it is quite possible that a portion of former Vios and Mirage G4 buyers are simply moving into taller, larger vehicles, and in some cases into a more electrified powertrain.
Pickup demand also contracted in 2025 as the removal of the excise-tax exemption materially increased prices in H2. Unlike sedans and crossovers, the pickup segment had little high-volume electrified substitution. New-energy entrants such as the BYD Shark 6 DMO and Changan Hunter K50 remained relatively small compared with the established diesel pickup market.
Supply chain and geographic power
In 2025, vehicles sourced from these three markets accounted for around 367,000 units, equal to roughly 75% of the 492,558 total TMS vehicle market.
But the balance of power is starting to shift. Indonesia has emerged as the largest manufacturing source, Philippine assembly remains material and Thailand is becoming more exposed to weakening pickup demand. China is no longer simply a secondary source; it is growing rapidly, and our 2026 forecast puts it on broadly similar terms with Thailand and the Philippines.
The shift becomes even clearer when we look at our 2026 forecast. China-sourced vehicles are forecast to increase from around 57,000 units in 2025 to 82,000 in 2026, growth of almost 44%, even as the overall Philippine vehicle market is expected to contract by 7.6%. Over the same period, sourcing from Indonesia, Thailand and the Philippines all declines.
So China is not simply gaining because the Philippine automotive market is growing. It is taking a much larger share of vehicle supply within a contracting market, which is a much more significant change.
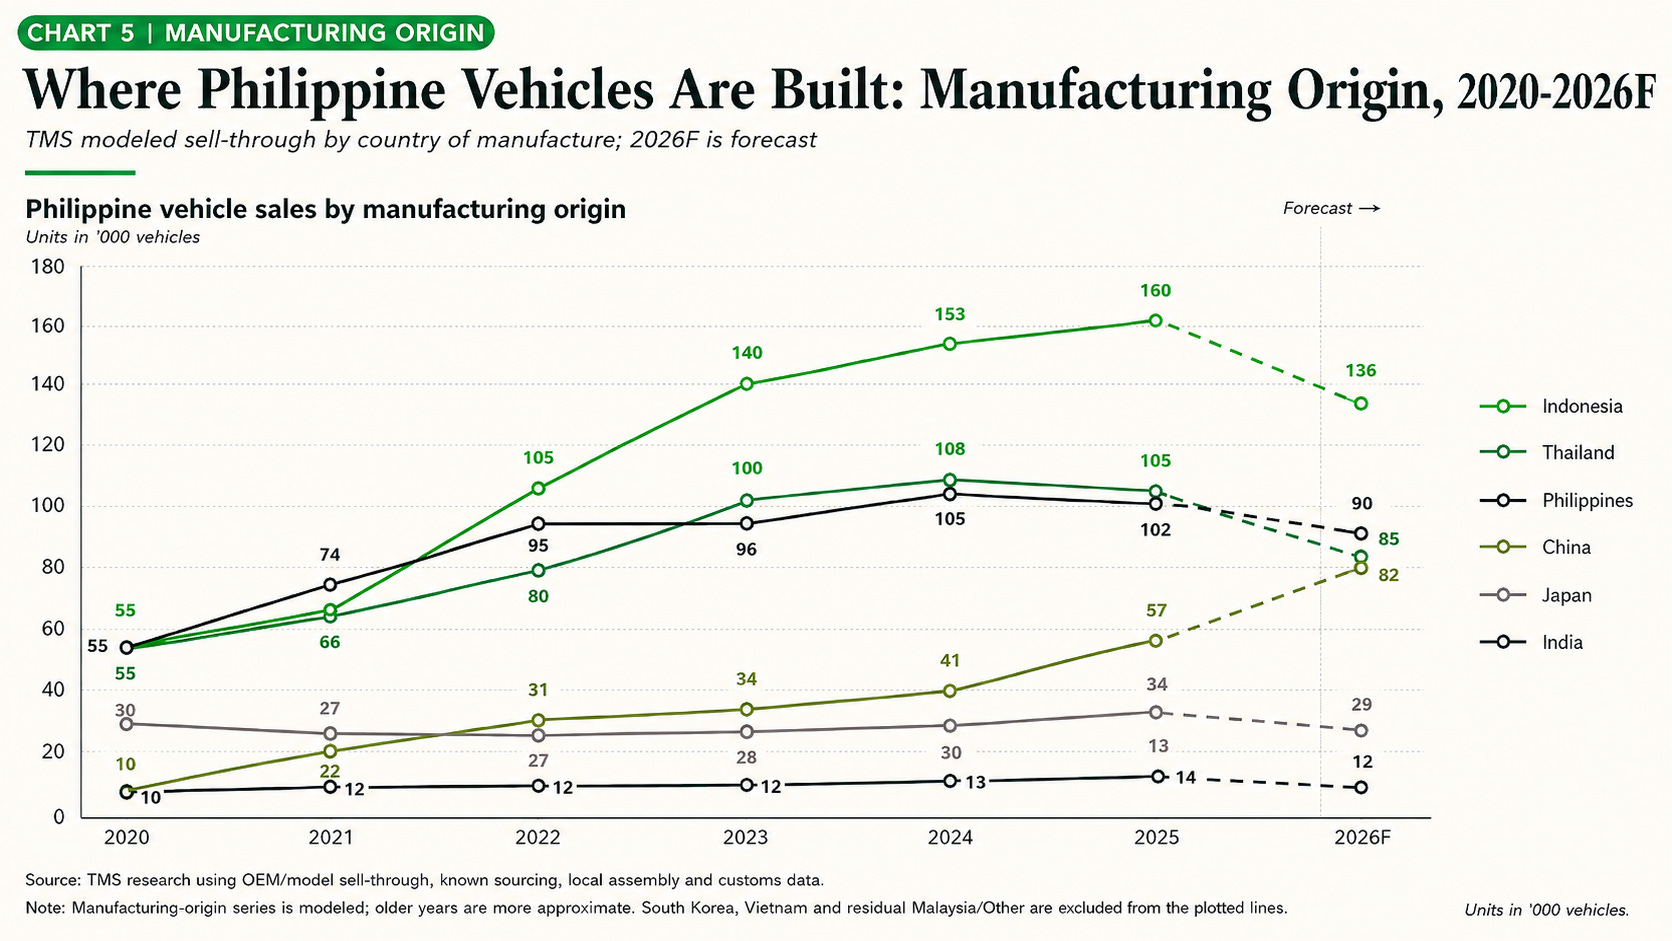
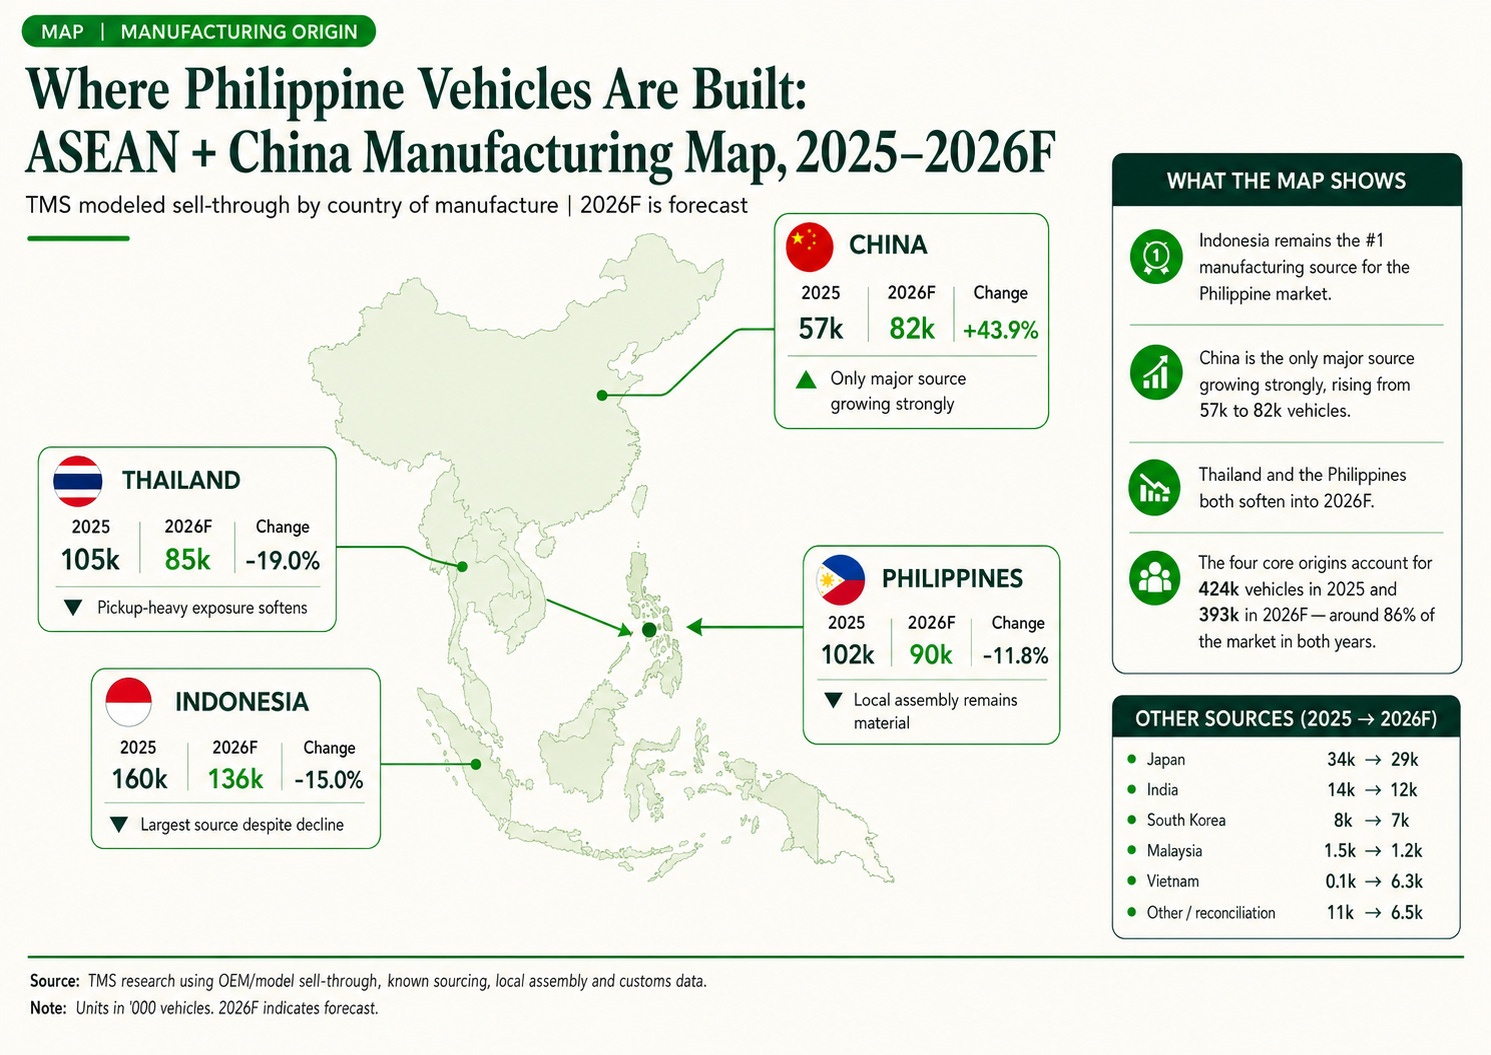
Indonesia is primarily exposed to the big Japanese brands and their MPVs, hatchbacks and SUVs. Key models include Avanza, Raize, Veloz, Fortuner, Zenix and the Yaris Cross from Toyota and the Xpander, Destinator and XForce from Mitsubishi. These nameplates have grown strongly since the pandemic, helping make Indonesia the number one manufacturing source for vehicles sold in the Philippines.
The Philippine local assembly market is focused around Toyota and Mitsubishi, centered on the Vios, Innova and Tamaraw and the Mitsubishi G4, Mirage and the L300. Local assembly therefore remains a material part of the market representing 20% of vehicle sales.
Thailand is where we start to see a more interesting story emerge. Thailand has traditionally been strong in the manufacture of Pickups for the Philippine market, with the Hilux, Triton, Ranger, Navara and D-Max all sourced from there. As we mentioned earlier, the pickup market was hit hard by new excise taxes in mid-2025, which we believe will also have an impact on 2026 shipments from Thailand.
China is the only manufacturing export hub showing rapid growth, rising from around 4% of Philippine new vehicle supply in 2020 to 12% in 2025 and could approach 18% in 2026. That puts China on broadly similar terms with Thailand and the Philippines as a manufacturing source. At its current pace China could become the number 2 source of new vehicles by 2027.
For more in-depth analysis of vehicle origins, see this article.
Philippine Vehicle Sales Reveal Asia’s Changing Auto Export Map
Moving from where the vehicles are actually manufactured and exported from, we now look at the country of origin of the brands themselves and which regions are commanding the Philippine market.
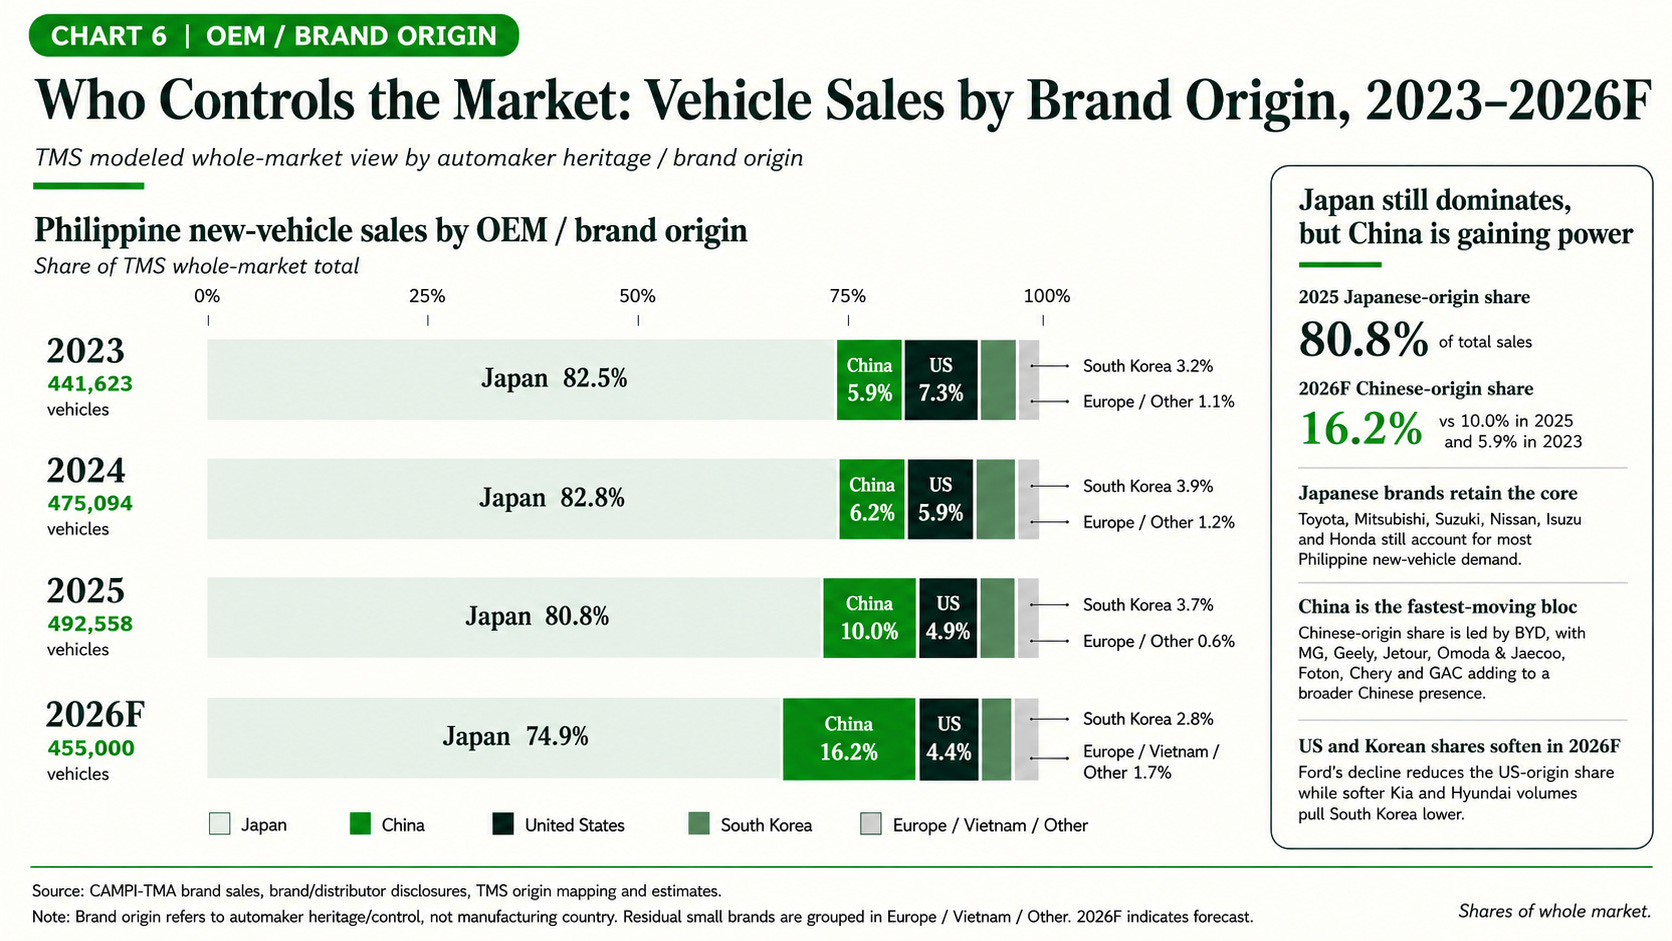
The two obvious data points from chart 6 are the continued dominance of Japanese brands, which accounted for around 80% of the market in 2025, and the rapid rise of Chinese brands, whose share increased from 5.9% in 2023 to 10% in 2025. Our 2026 forecast points to Chinese-origin share rising to around 16.2%, while Japanese-origin share falls to roughly 74.9%. US market share is also softening through Ford’s decline, although this is being partly offset by the growth of Tesla.
In the near term, we don’t see much stopping the growth of Chinese brands. The challenge for the Japanese automotive ecosystem is therefore to protect its dominant market position for as long as possible, while closing the gap with the Chinese brands on technology, electrification and price.
Technology
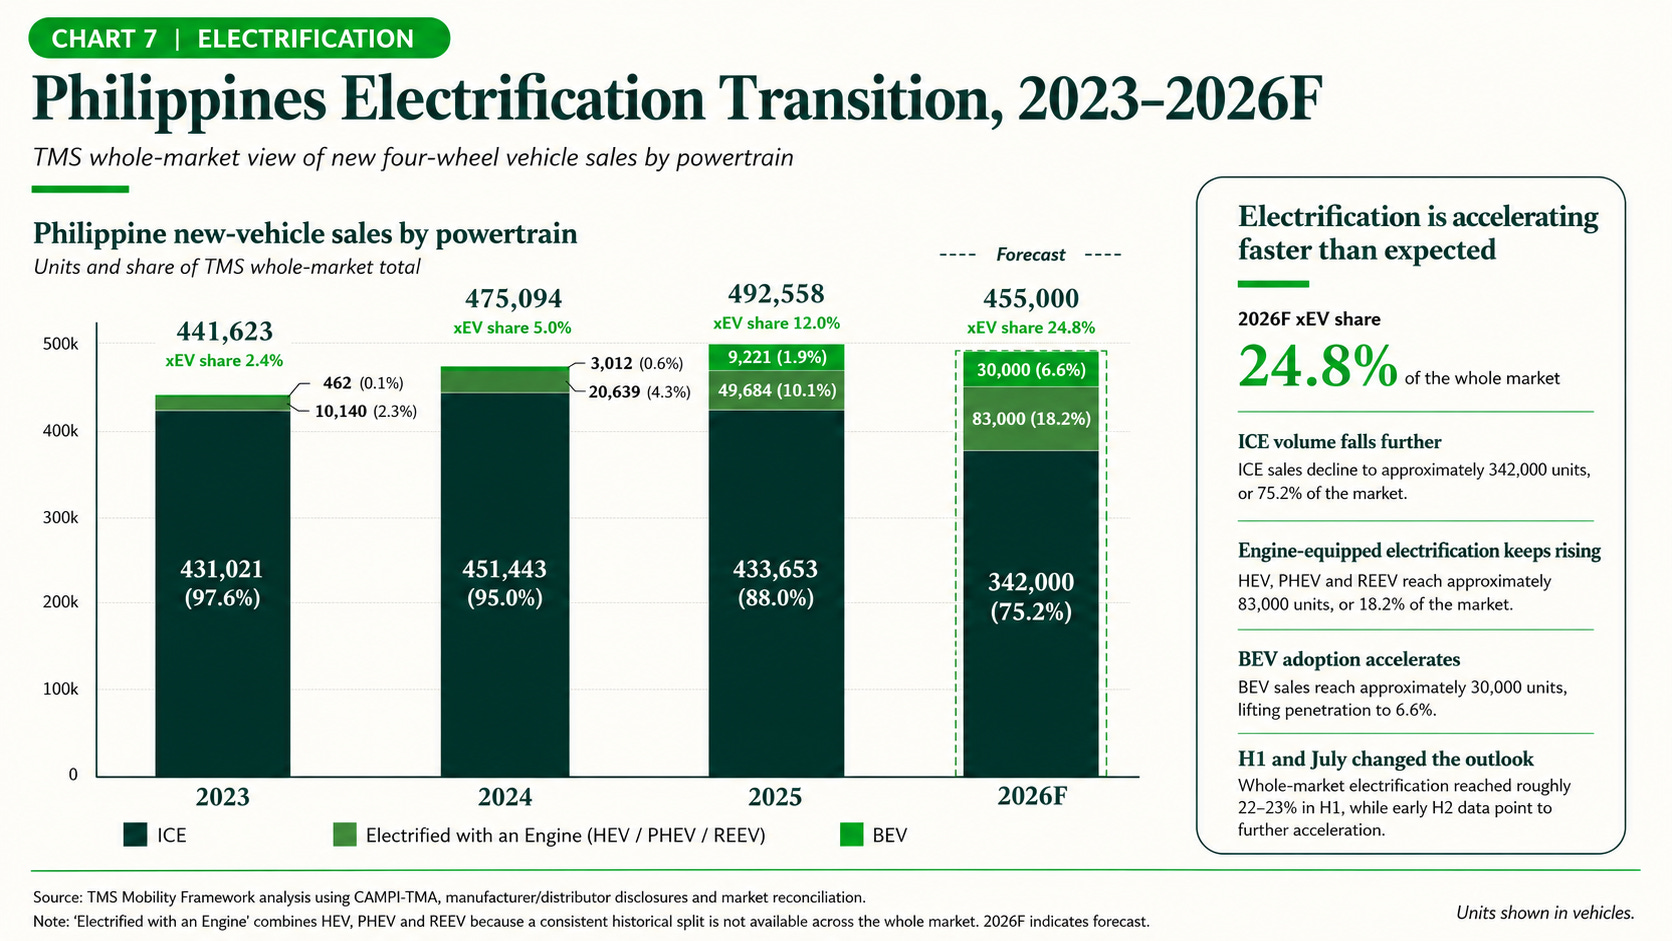
From 2024 to 2025, electrified vehicle sales rose sharply from around 5% to 12% of the total Philippine automotive market, increasing from approximately 24,000 to 59,000 units.
The transition accelerated further during H1 2026. Among CAMPI–TMA members, electrified vehicles represented 15.3% of sales, but this excludes several important non-member brands, most notably BYD. On a broader whole-market basis, ACMobility subsequently indicated that electrified vehicles accounted for approximately 22.3% of Philippine new-vehicle sales during H1 2026, broadly consistent with TMS’s own reconstruction of around 23% after incorporating our BYD estimate.
Early H2 data suggest that momentum is continuing. CAMPI–TMA members sold 7,086 electrified vehicles in July, while TMS estimates that BYD contributed approximately another 4,000 vehicles during the month. On that basis, CAMPI–TMA and BYD alone would account for roughly 11,100 electrified vehicles, equivalent to around 26% of the broader estimated July market, even before accounting for other non-member electrified brands.
These developments have caused us to revise our 2026 outlook quite significantly. While the overall Philippine vehicle market is still expected to decline by around 7.6%, electrified vehicle sales are now forecast to increase from approximately 59,000 units in 2025 to around 113,000 in 2026. That would lift electrified market share from 12.0% to around 24.8%.
Electrified sales could almost double in a market down 7.6%.
This is important because electrification is not simply benefiting from growth in the wider automotive market. It is taking significant share inside a contracting market, suggesting that the change in powertrain demand is becoming increasingly structural.
What is also becoming clearer is that the Philippine transition is no longer simply hybrid-led. HEVs remain important, but PHEVs and DM-i/DMO vehicles are expanding rapidly, while BEV adoption is also accelerating. Our revised 2026 forecast now puts engine-equipped electrified vehicles at around 83,000 units, or 18.2% of the market, with BEVs reaching approximately 30,000 units, or 6.6%.
Read more about how the engine transition is evolving in the Philippines.
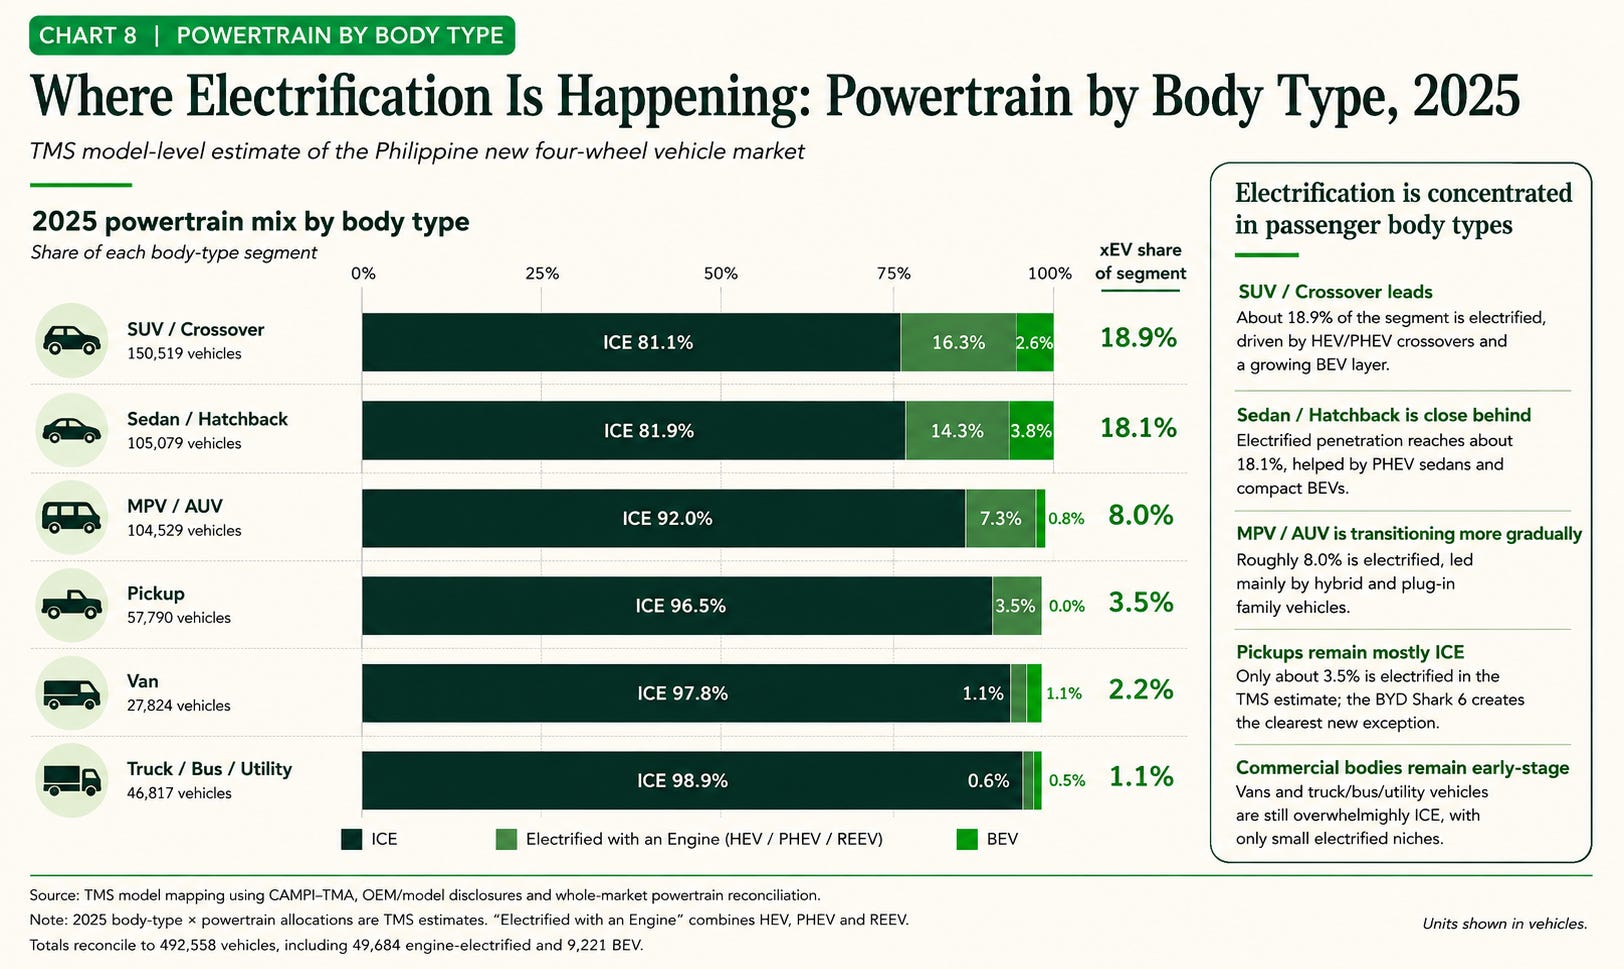
Electrification is happening at different speeds across multiple body types, and in many cases these are exactly the segments where Chinese brands and Toyota are focusing their technology. The SUV/Crossover and Sedan/Hatchback categories are currently the key body types driving the electrified market, which makes sense given the number of electrified models BYD, Toyota and other brands now offer across these segments.
What we are likely to see next is a further acceleration in the MPV/AUV and pickup segments over the next 12 months, as more electrified models enter the market and buyers are given a wider choice across different price points and vehicle uses.
Competition and outlook
Over the past decade, the Philippines has become used to the top 10 brands being dominated by Japanese manufacturers, especially Toyota, alongside Ford and usually one of the South Korean brands. Over the last few years that picture has started to change. We now have two established Chinese brands sitting solidly within the top 10 in BYD and MG (SAIC). BYD in particular has shown impressive growth registering over 26,000 sales in 2025, capturing over 5% market share and becoming the third-largest automotive brand in the Philippines.
Toyota and Mitsubishi remain dominant, together accounting for 64% of the total market, but pressure is starting to build, with seven of the top 20 brands now from China.
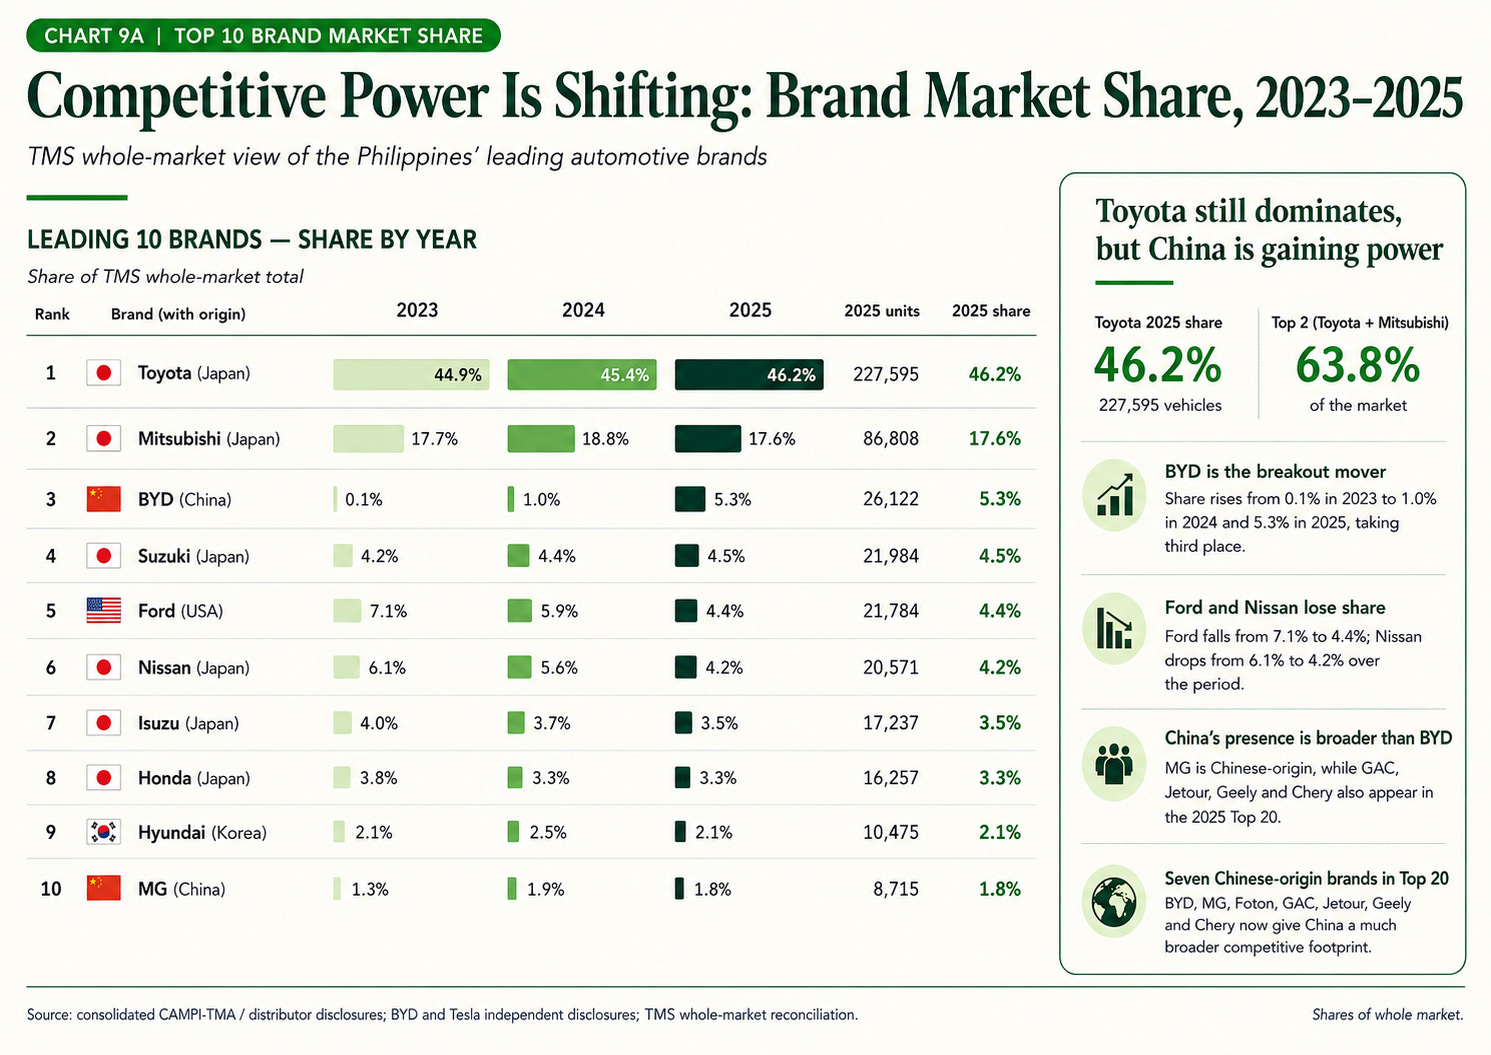
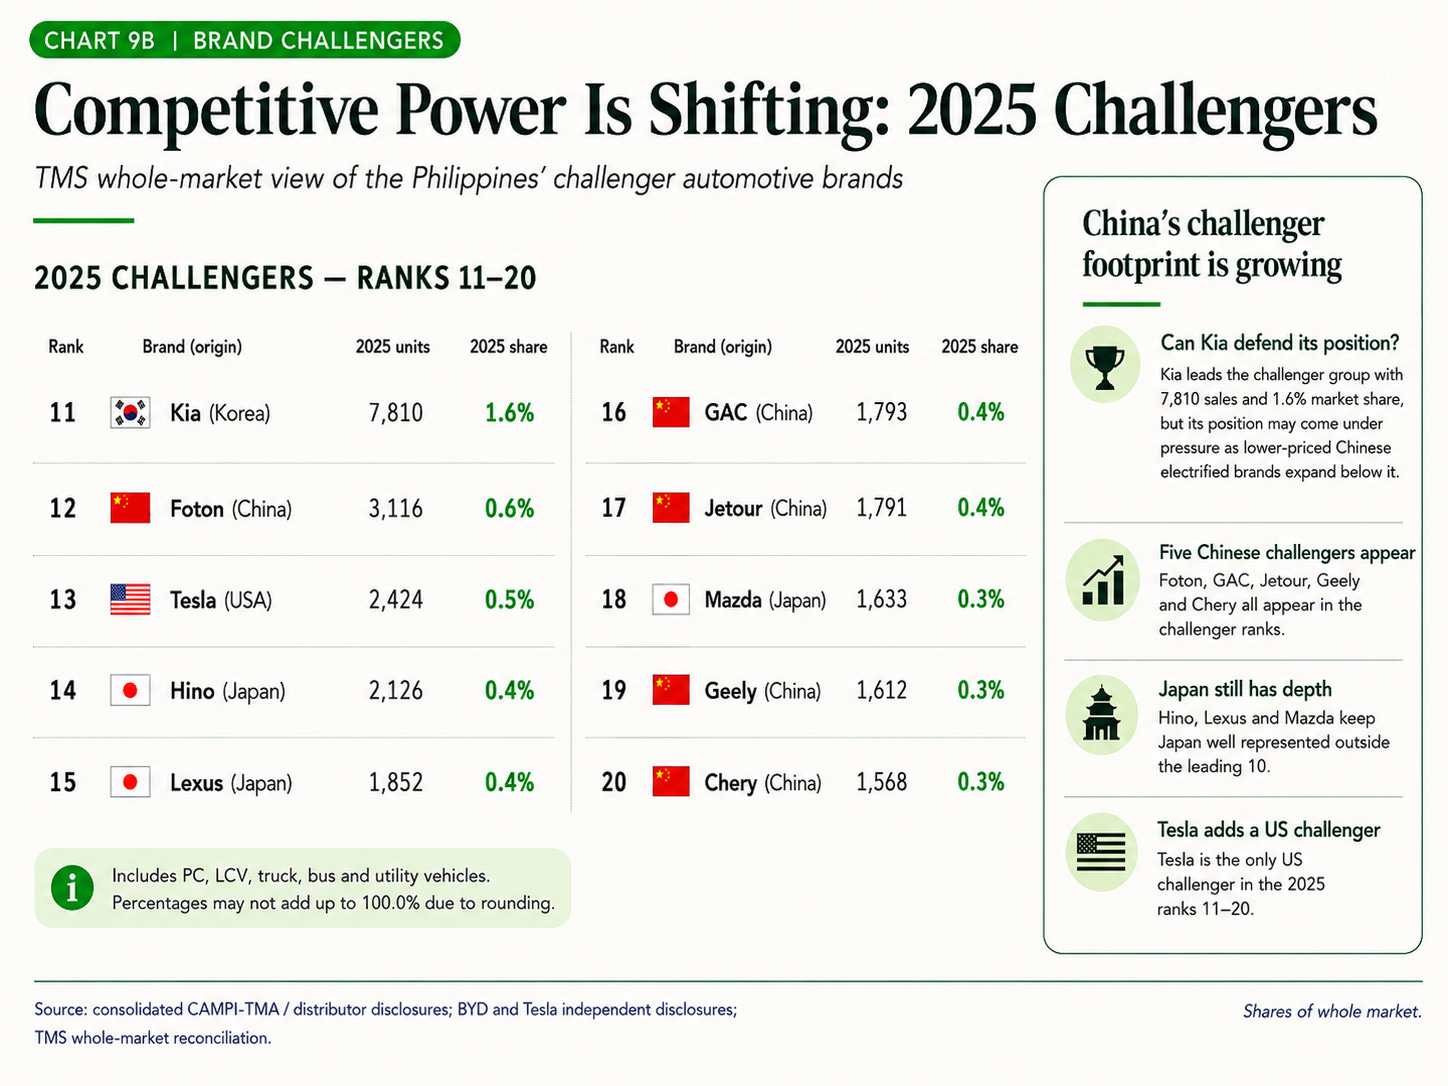
The reason we have placed country flags next to each brand is to highlight how it’s becoming less about individual brands and increasingly about which automotive regions will shape the electrification era. As you can see from the chart Japan versus China is becoming a key battle, with Ford and Tesla representing the US.
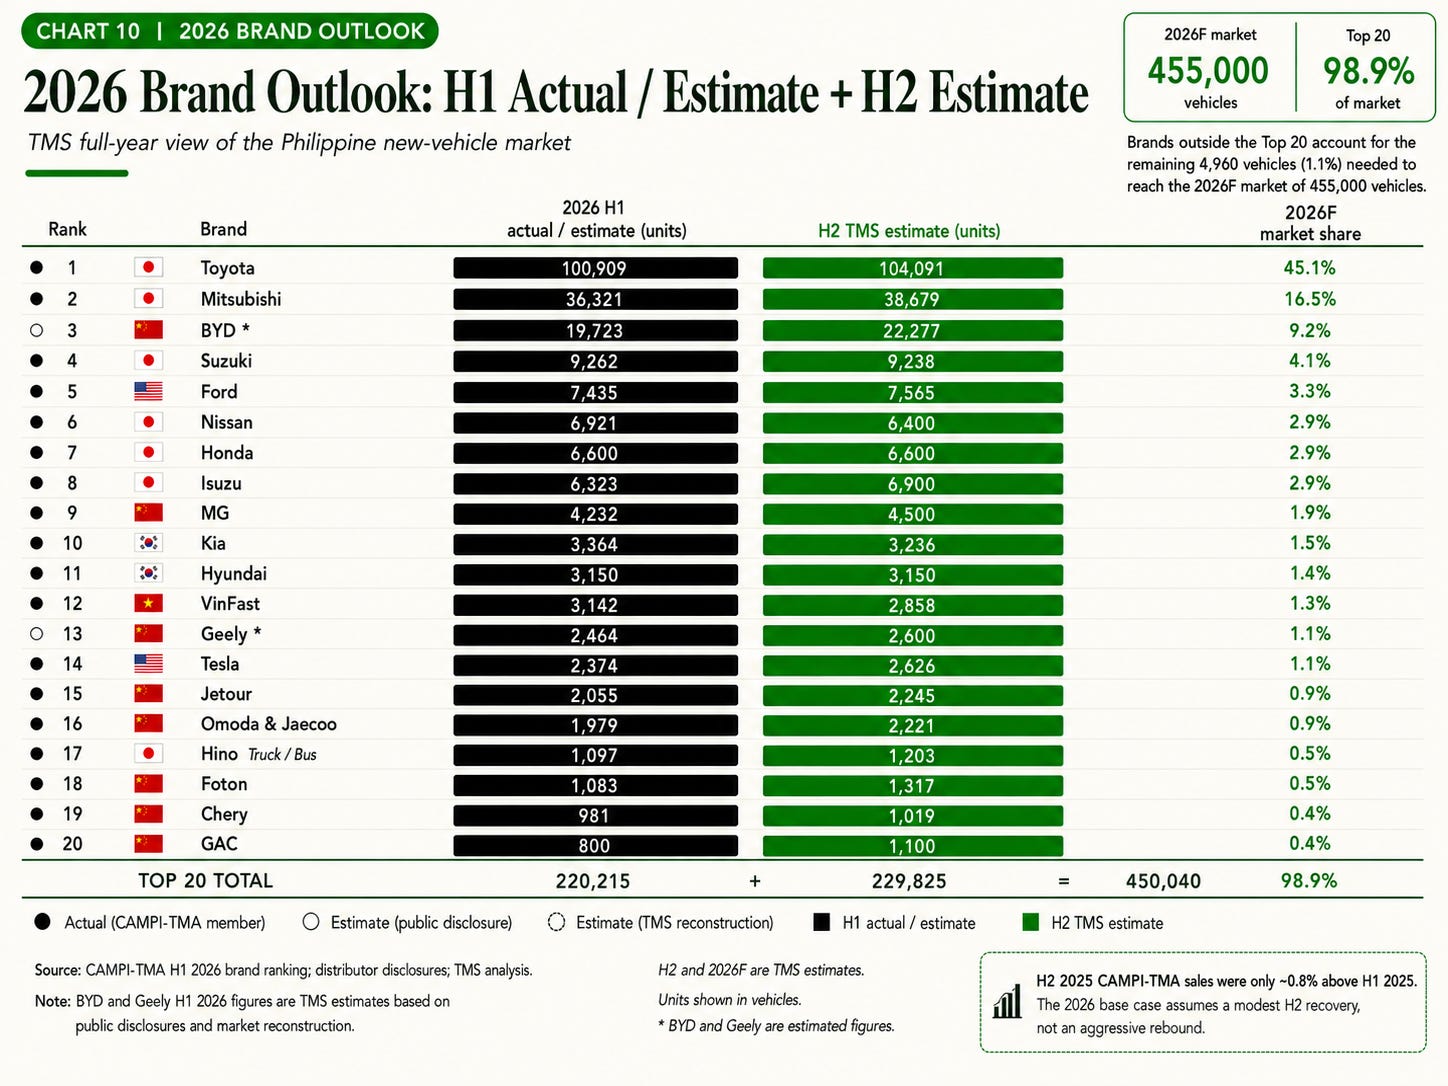
As we reflect on H1 2026, we see a clear acceleration in electrification, even though it looks like the overall market will finish the year lower on total sales.
The Iran crisis also highlighted the Philippines’ volatile relationship with fuel prices, reinforcing the appeal of hybrids and BEVs for buyers looking to reduce their exposure to gasoline prices.
What’s particularly interesting about H1 2026 is how sharply many of the incumbent top 10 brands have declined compared to H1 2025. Ford, Nissan, Isuzu and Hyundai were all down by more than 25%, while even Toyota, the clear market leader, was down 9.3% year on year.
On the other hand, several Chinese brands, particularly BYD, Geely, Jetour and Omoda & Jaecoo, along with VinFast and Tesla, showed strong growth. With a wider choice of electrified vehicles, advanced technology and attractive price points, these newer competitors are gaining market share and starting to reshape the top 20 brands in the Philippines.
Our TMS forecast for 2026 is potentially showing a marked shift in market share as the incumbent brands come under increasing pressure from these electrified newcomers. In 2025 Japanese brands commanded 80% of total sales, with Chinese brands accounting for 10%. Our forecast is now pointing towards approximately 75% market share for Japanese brands and 16% for Chinese by the end of 2026, which would represent quite a significant change in just one year.
Toyota still has a commanding lead and plenty of time to strengthen its position within the evolving electrification landscape. Mitsubishi, however, faces a more immediate challenge, with BYD rapidly closing the gap.
In 2025, Mitsubishi sold around 86,800 vehicles, compared with approximately 26,100 for BYD, a gap of more than 60,000 units. Our 2026 forecast sees Mitsubishi declining to around 75,000 units, while BYD rises to approximately 42,000.
That would narrow the gap between the two brands to only around 33,000 units in a single year.
BYD is therefore still some distance from overtaking Mitsubishi, but the direction of travel is becoming much harder to ignore. If BYD can sustain its growth while Mitsubishi volumes continue to soften, the battle for second place could become a much more realistic question over the next few years.
The bigger picture, however, goes beyond the individual brand rankings. The headline for 2026 may be a smaller Philippine automotive market, but underneath that softer sales number the market is changing quite quickly. Electrification is gaining share much faster than we originally expected even as the overall market contracts, China is becoming more important both as a manufacturing source and through its brands, and competition across the established rankings is becoming much more intense.
At the same time, our economic-use analysis suggests that the market remains far more passenger-oriented than traditional industry classifications imply. So while total vehicle sales may decline in 2026, the types of vehicles Filipinos are buying, where those vehicles are being manufactured, the technology powering them and the brands gaining share are all changing at the same time.