


A large market hiding in plain sight
A common question from investors and regional businesses is: what is the size and opportunity of the used-vehicle market in the Philippines? This has never been easy to answer, because unlike the new car market, there is no specific dataset available.
Using our knowledge of the Philippine automotive market we have created a framework to estimate used vehicle sales and then break the market down by vehicle segment, geographical location, market value and growth factors.
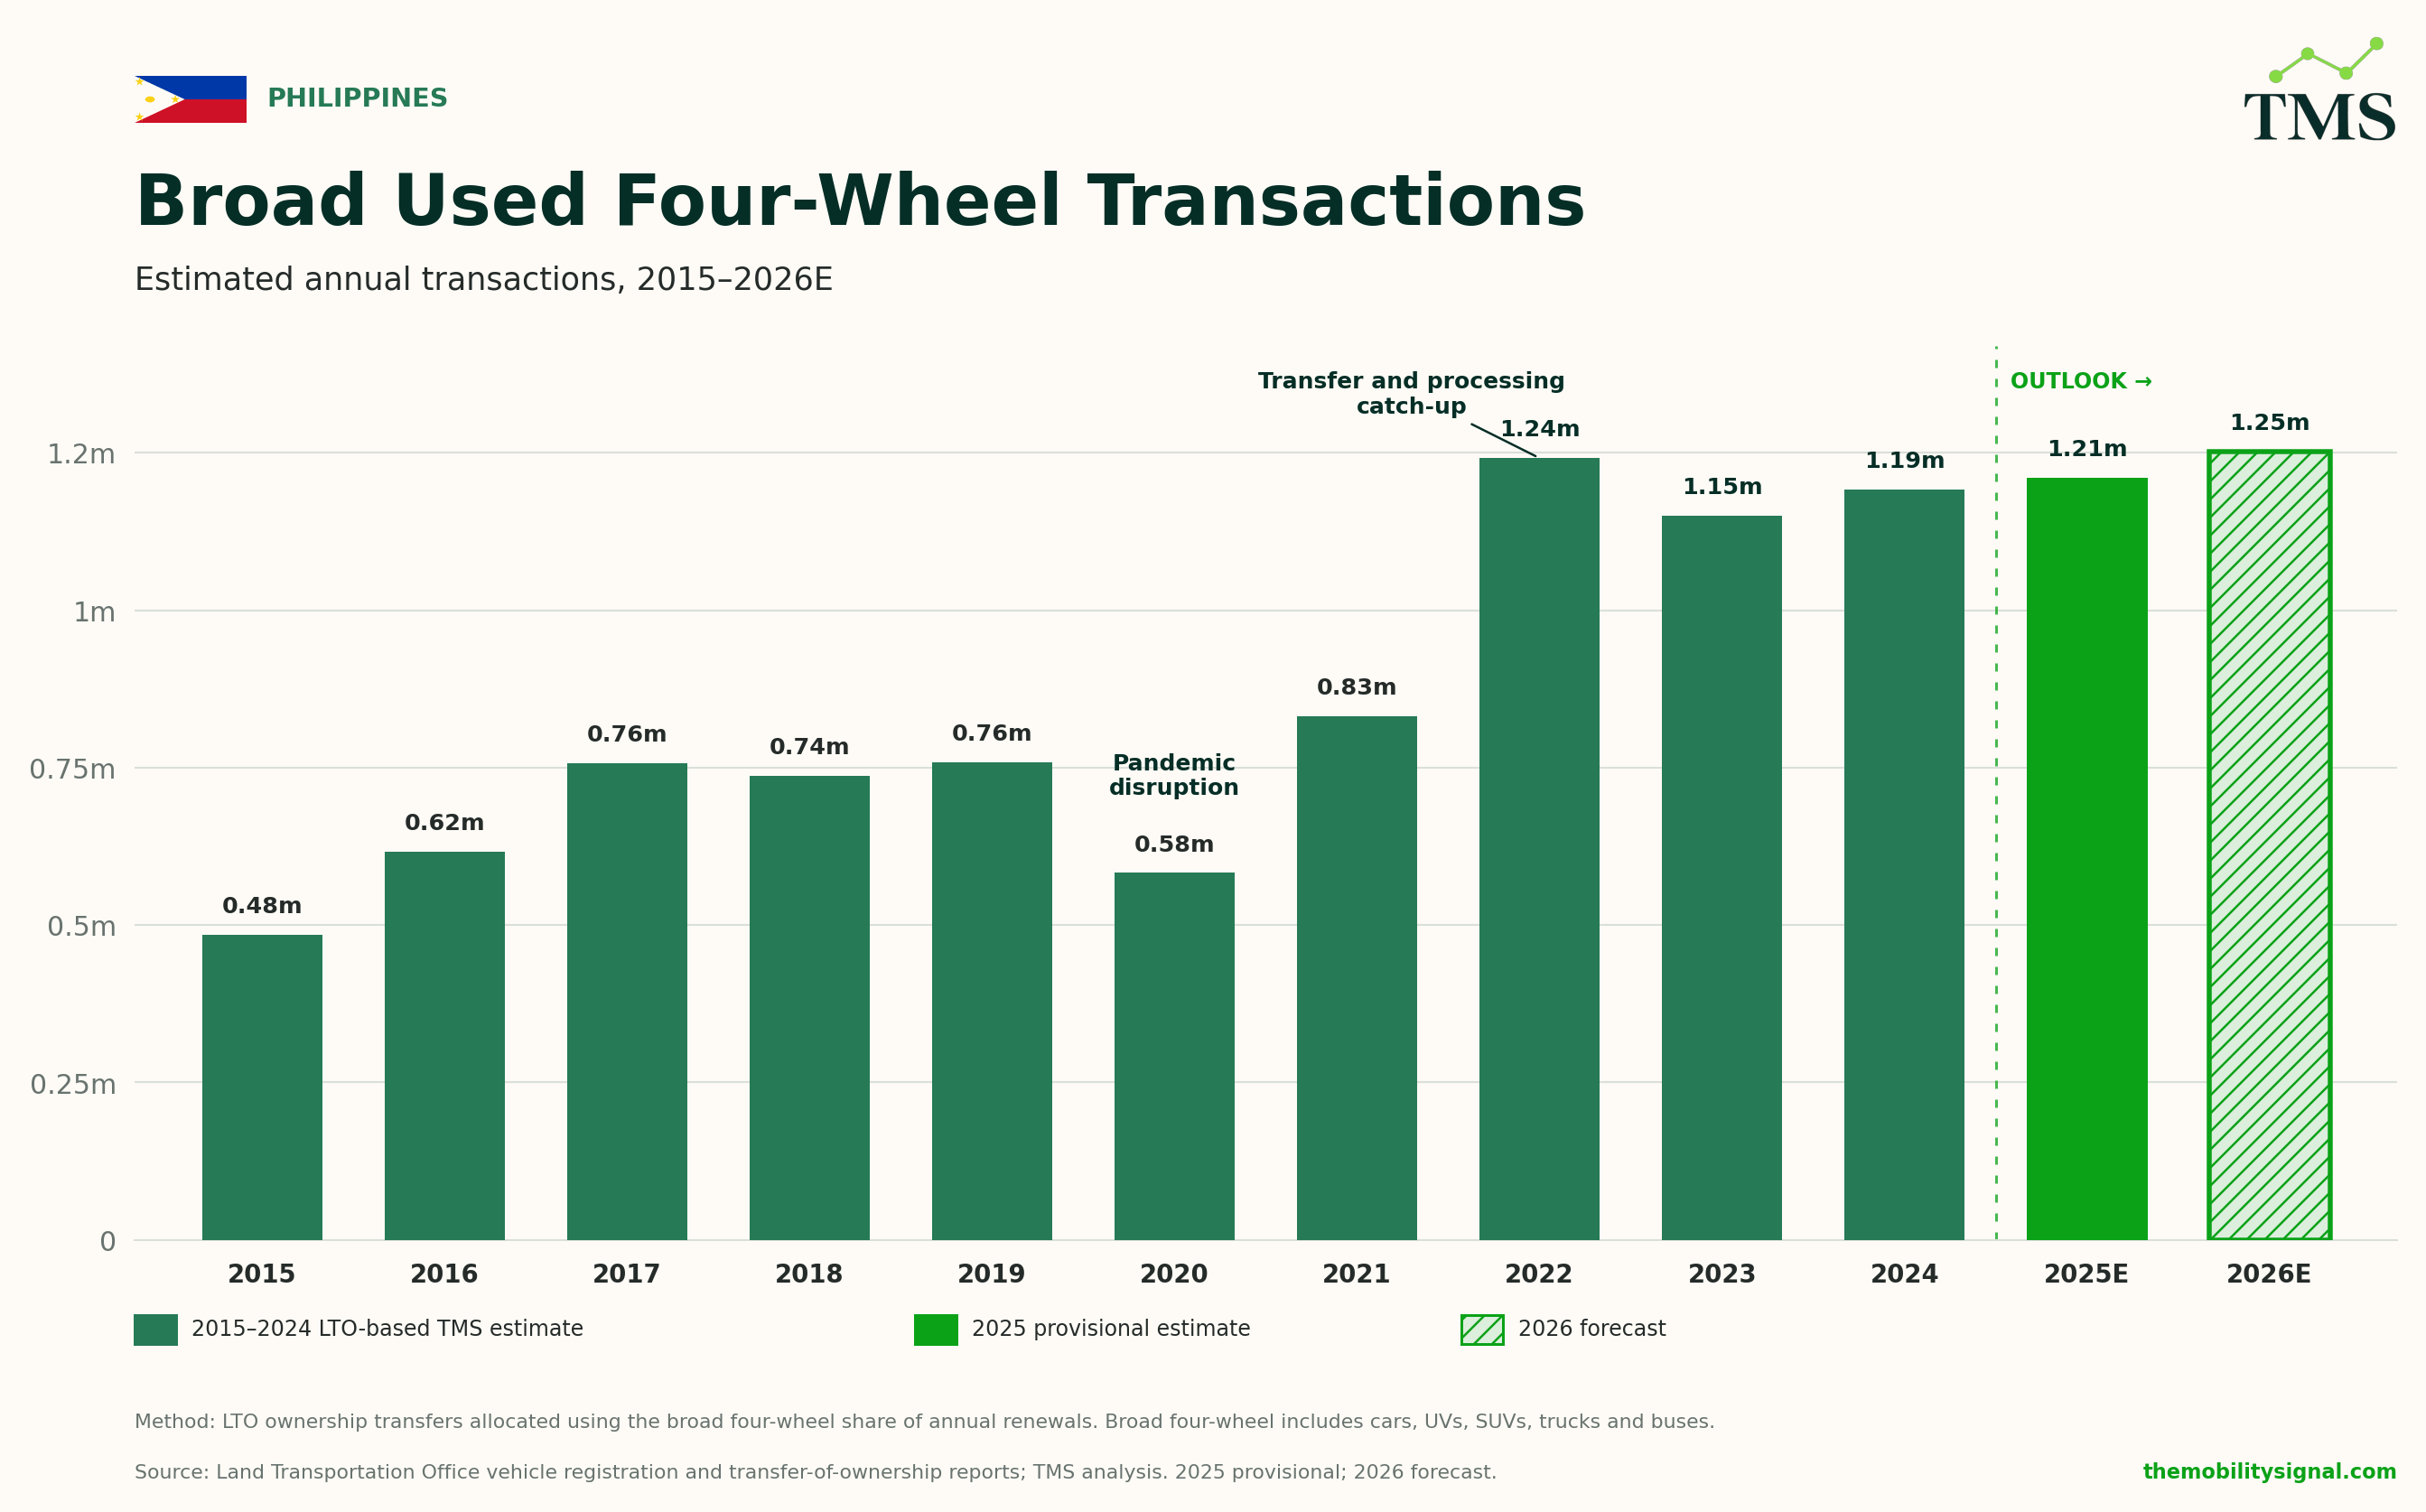
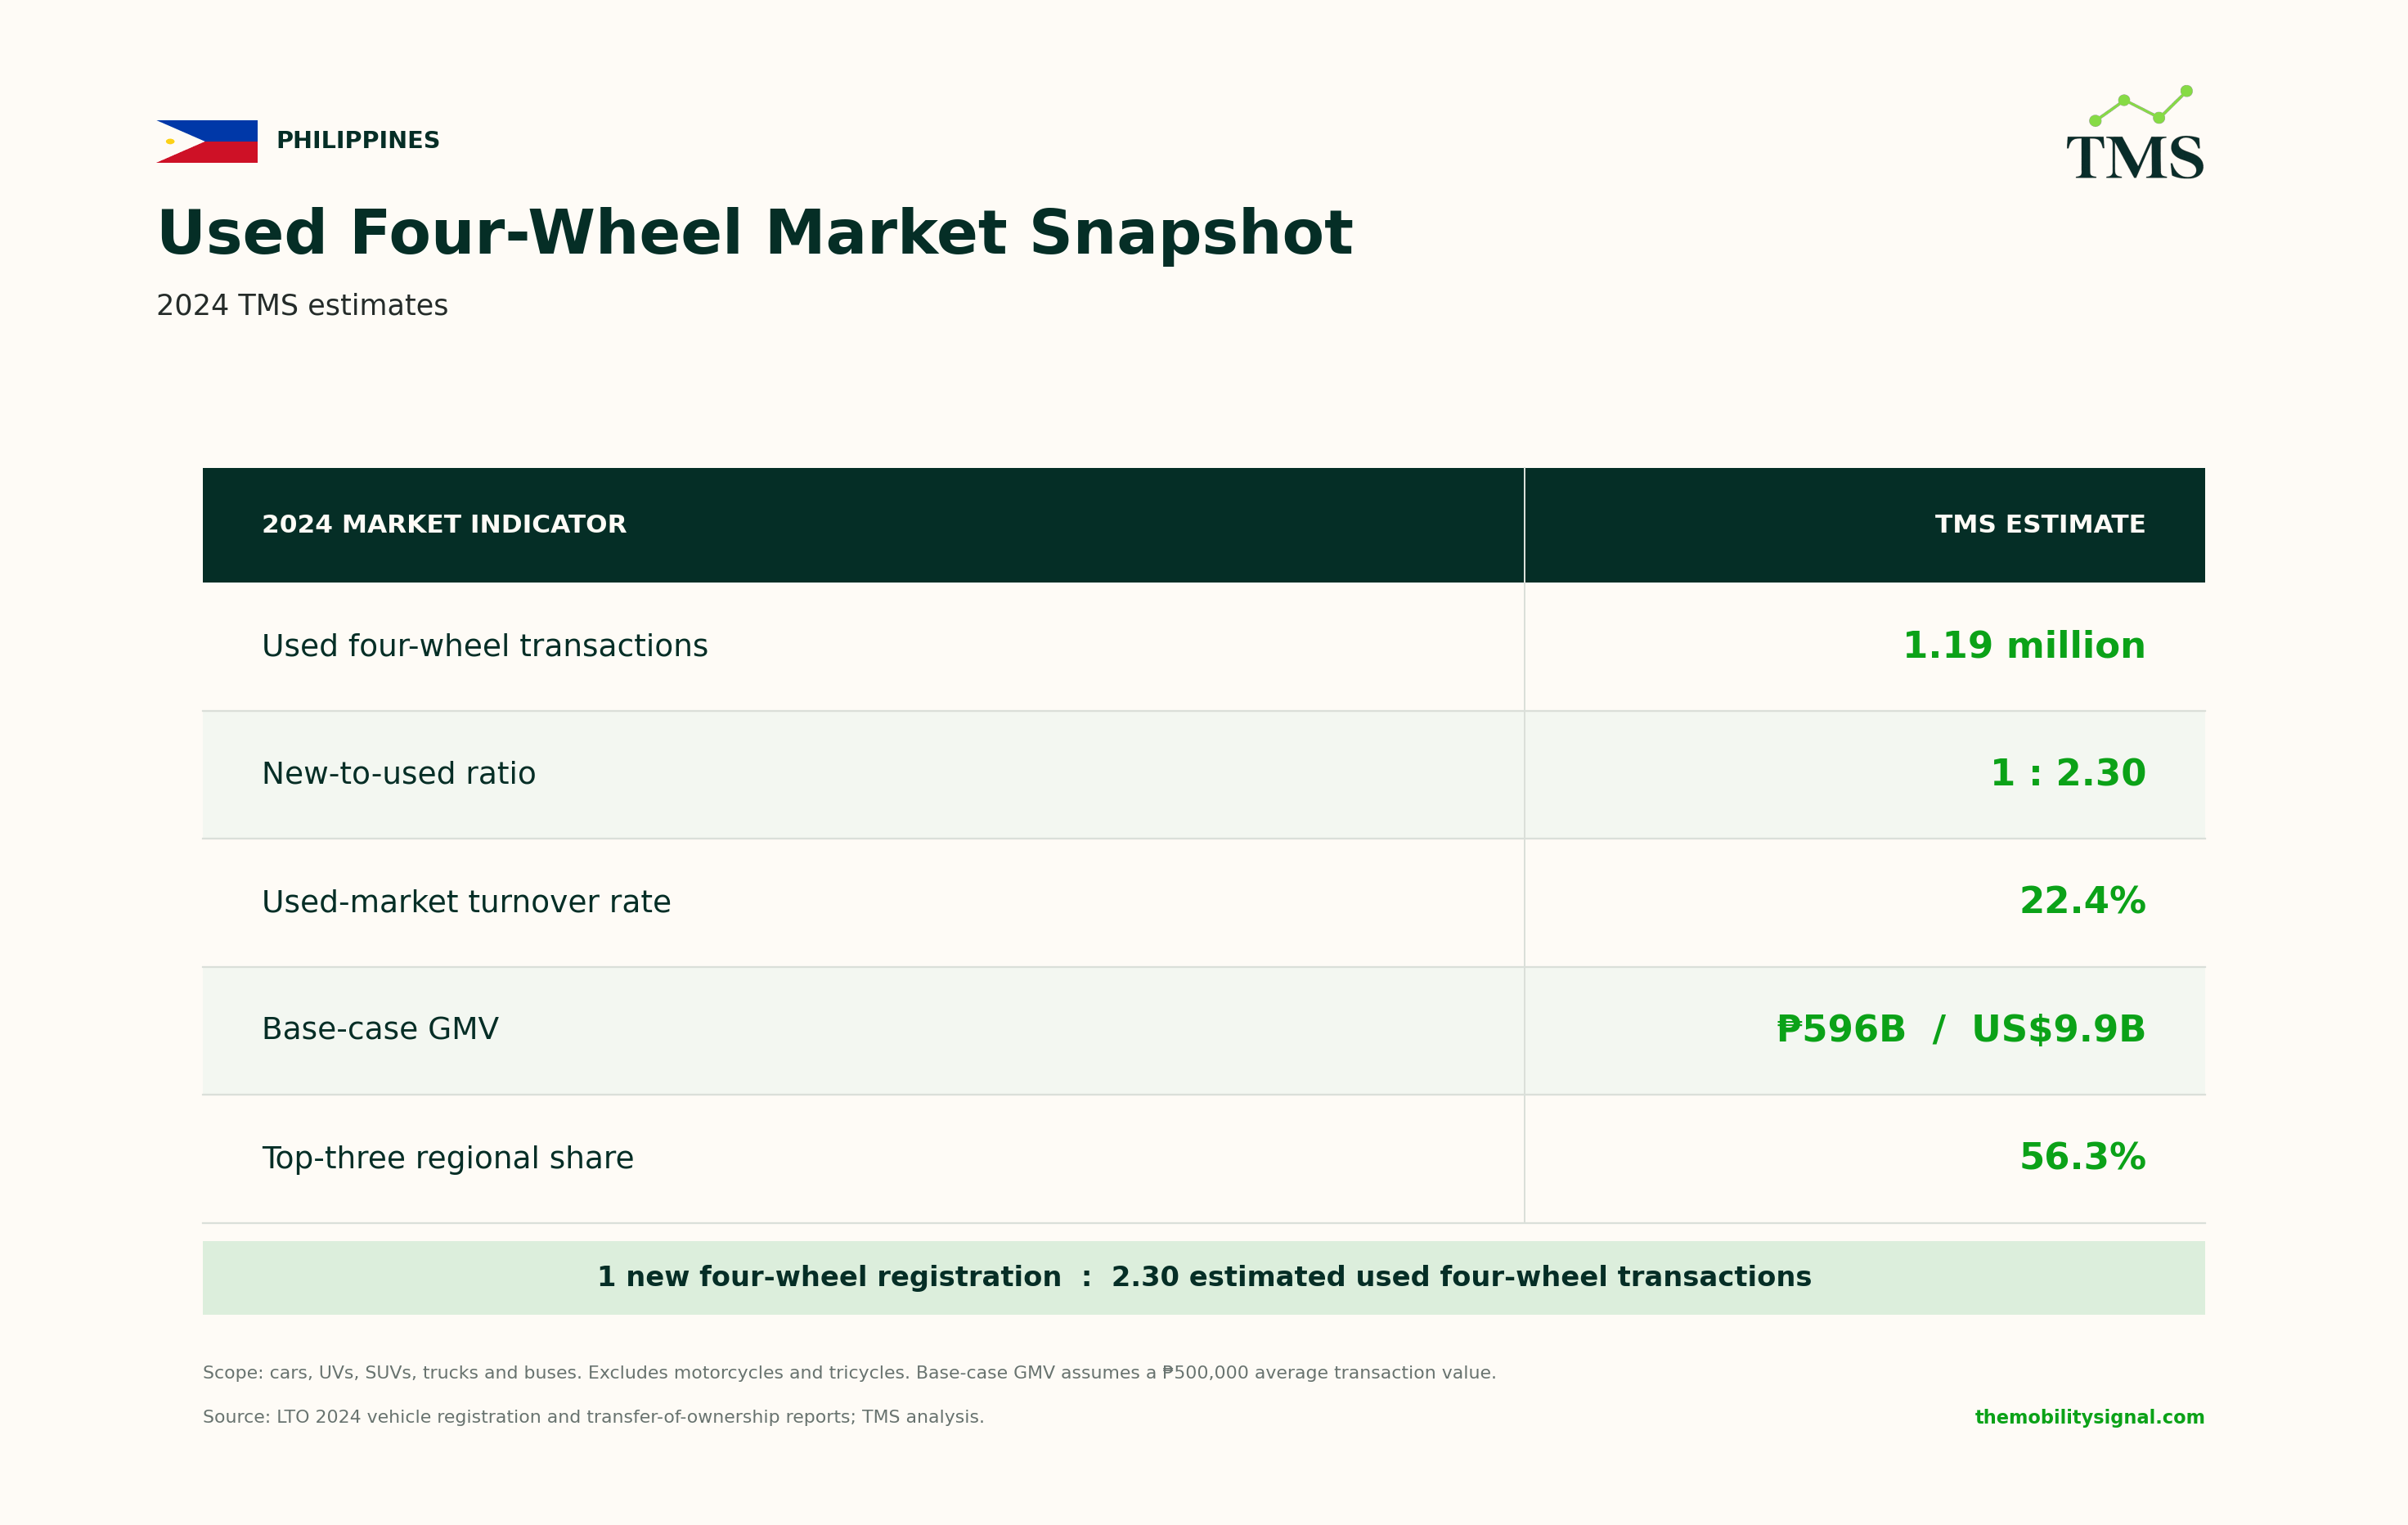
Using a combination of LTO ownership-transfer data along with four-wheel vehicle share of total renewals, we estimate that there were approximately 1.19 million used four-wheel transactions in 2024, compared with around 518,000 new four-wheel registrations. This implies there were approximately 2.3 used four-wheel transaction to every new registration.
Below is a brief summary of the key data for 2024.
How TMS estimates the used four-wheel market
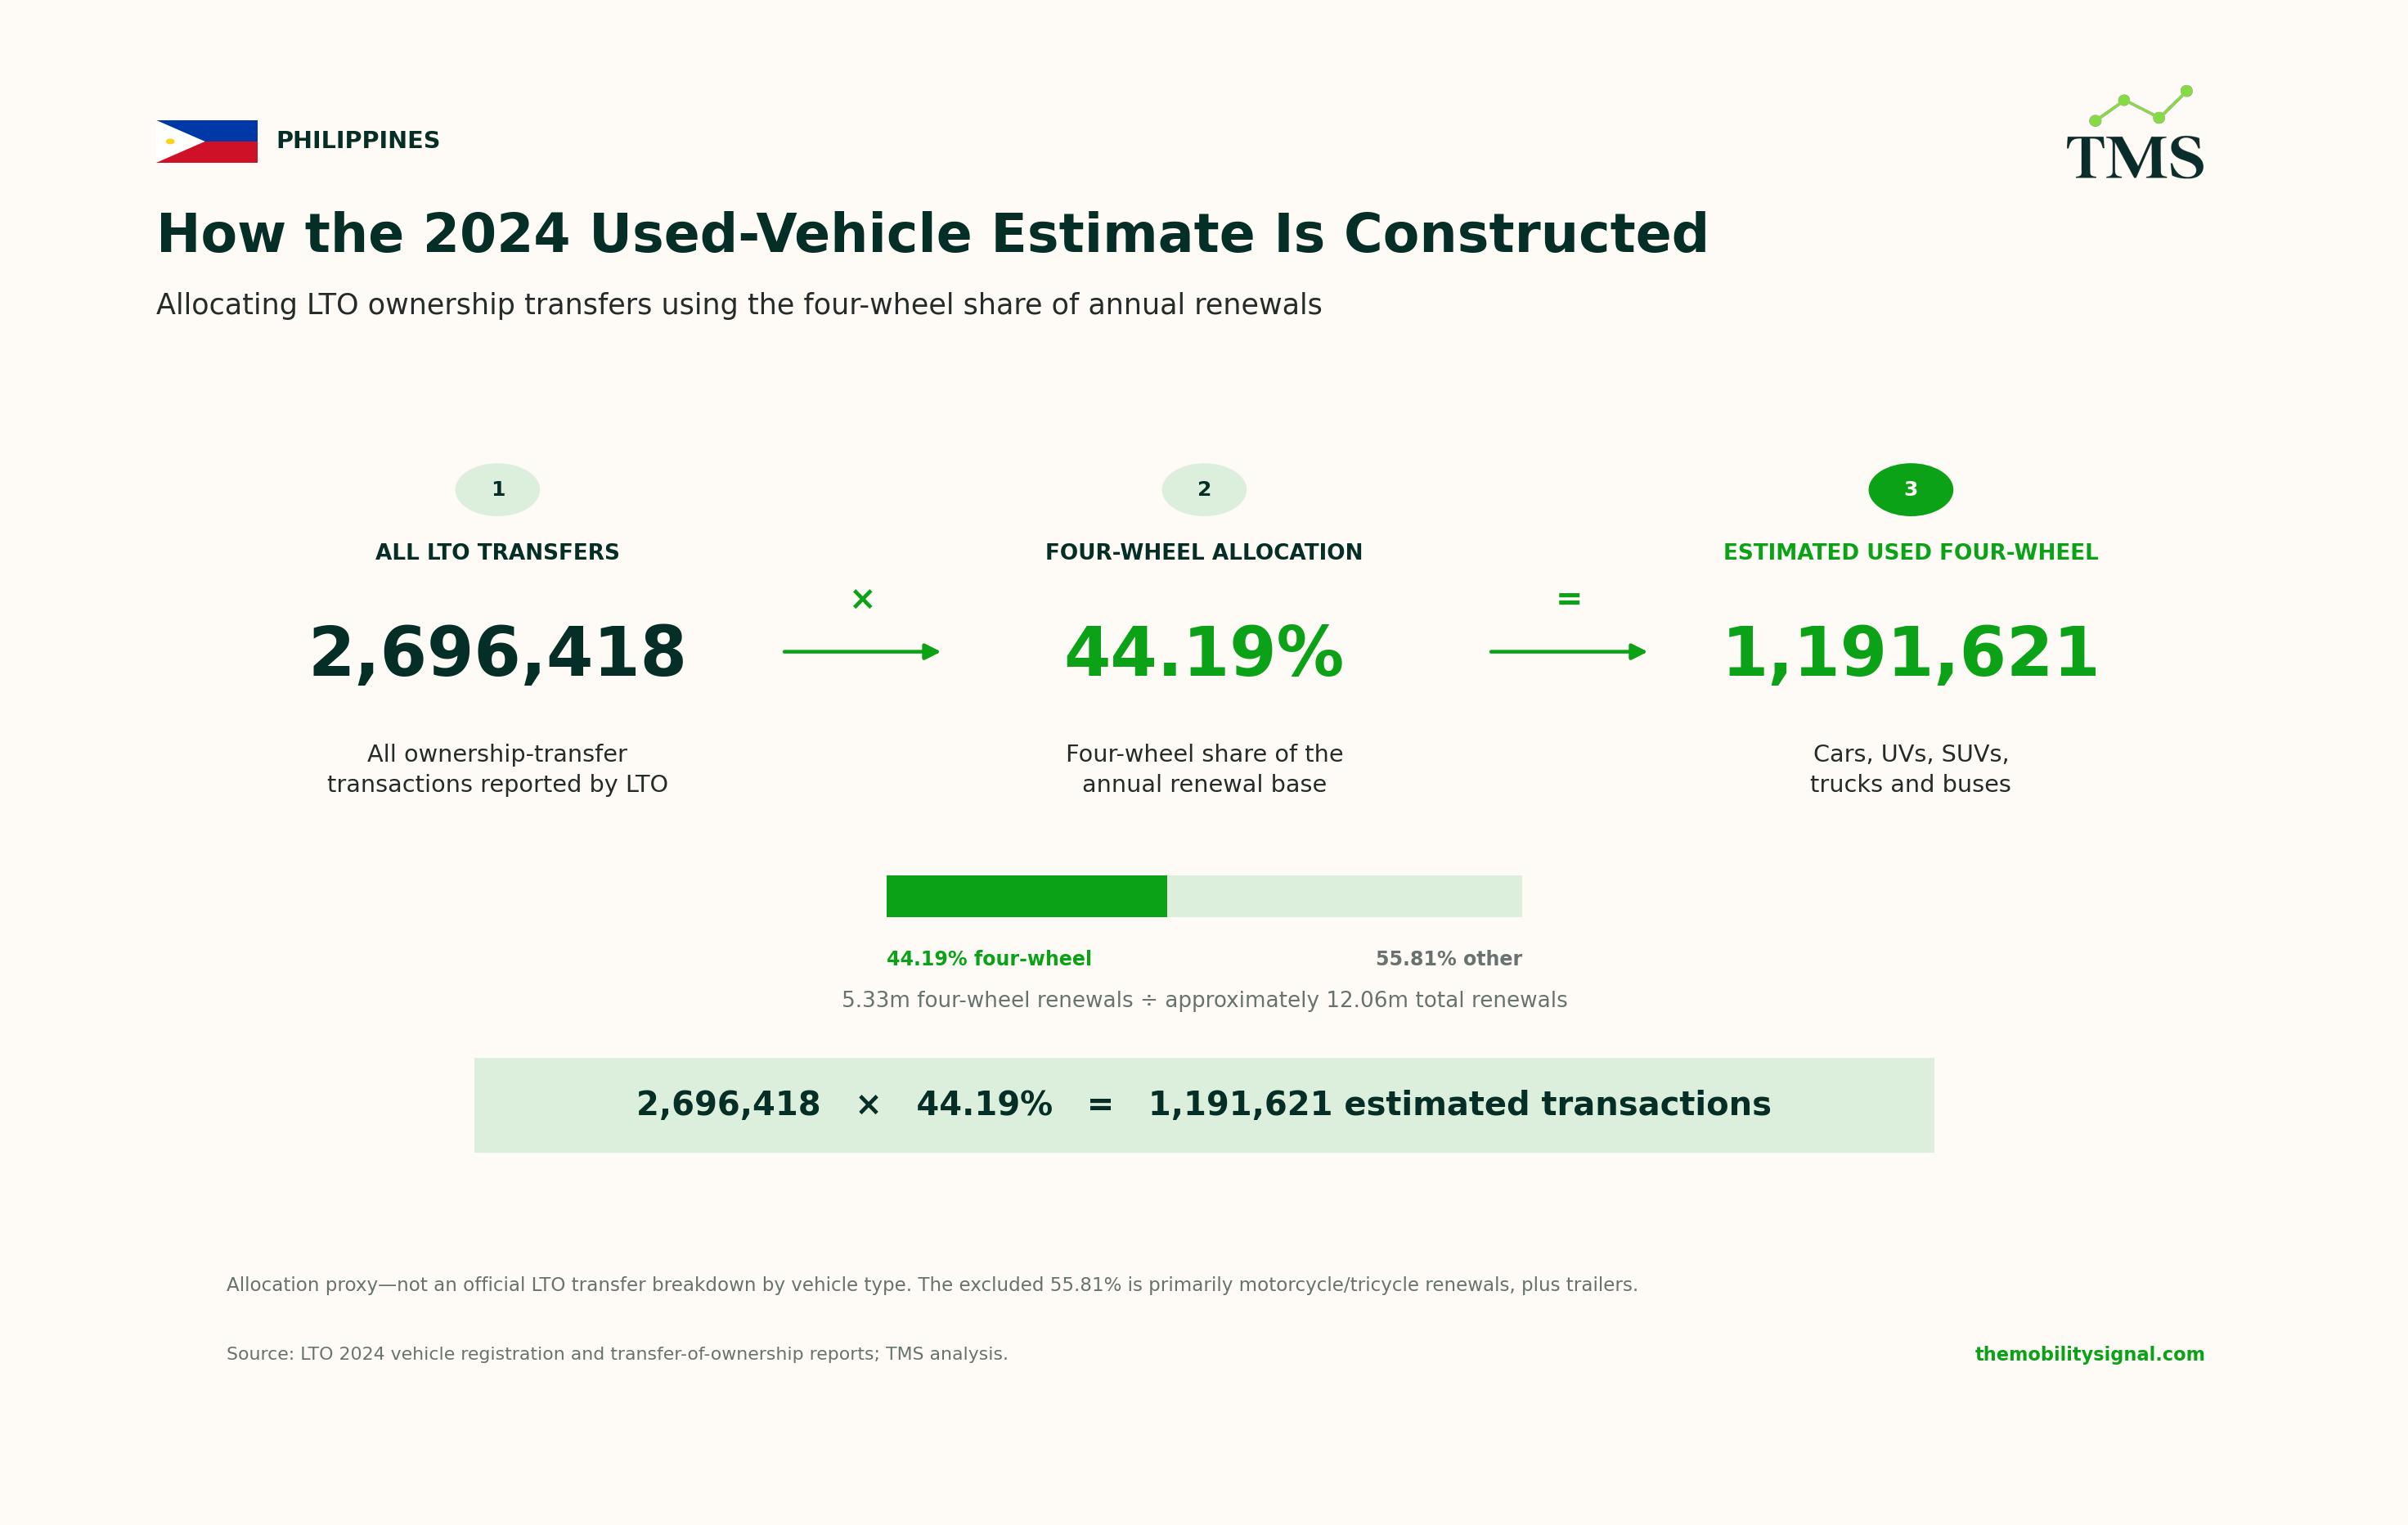
The LTO (Land Transportation Office) does not publish ownership transfers by vehicle type. However, it did report 2,696,418 transfers in 2024, but this figure included motorcycles, tricycles, trailers and others alongside four-wheel vehicles.
We therefore allocated total ownership transfers using the four-wheel share of annual vehicle renewals. Total vehicle renewals were approximately 12.06 million in 2024, and 5.33 million, or 44.19% were for cars, UVs, SUVs, trucks and buses.
We applied this broad four-wheel share of renewals to total recorded ownership transfers to produce the TMS estimate.
Calculate the four-wheel share of renewals:
(5,327,731 / 12,055,670) = 0.441927 = 44.19%
Now we can calculate the estimated four-wheel transactions:
2,696,418 (Total transfers) x 0.441927 (Share of renewals) = 1,191,620
This is not a perfect measure; it’s a framework estimate. We assume that four-wheel vehicle ownership-transfer rate is the same as the overall renewed vehicle population. For example, the ownership-transfer rate may be higher among motorcycles compared to four-wheel vehicles, which would affect the estimate.
We must also account for transactions that are not formally transferred, transfers completed after the underlying sale and administrative processing backlogs. These factors may cause recorded transfers to differ from underlying used-vehicle sales in a particular year.
The used market is broader than the LTO “Cars” category
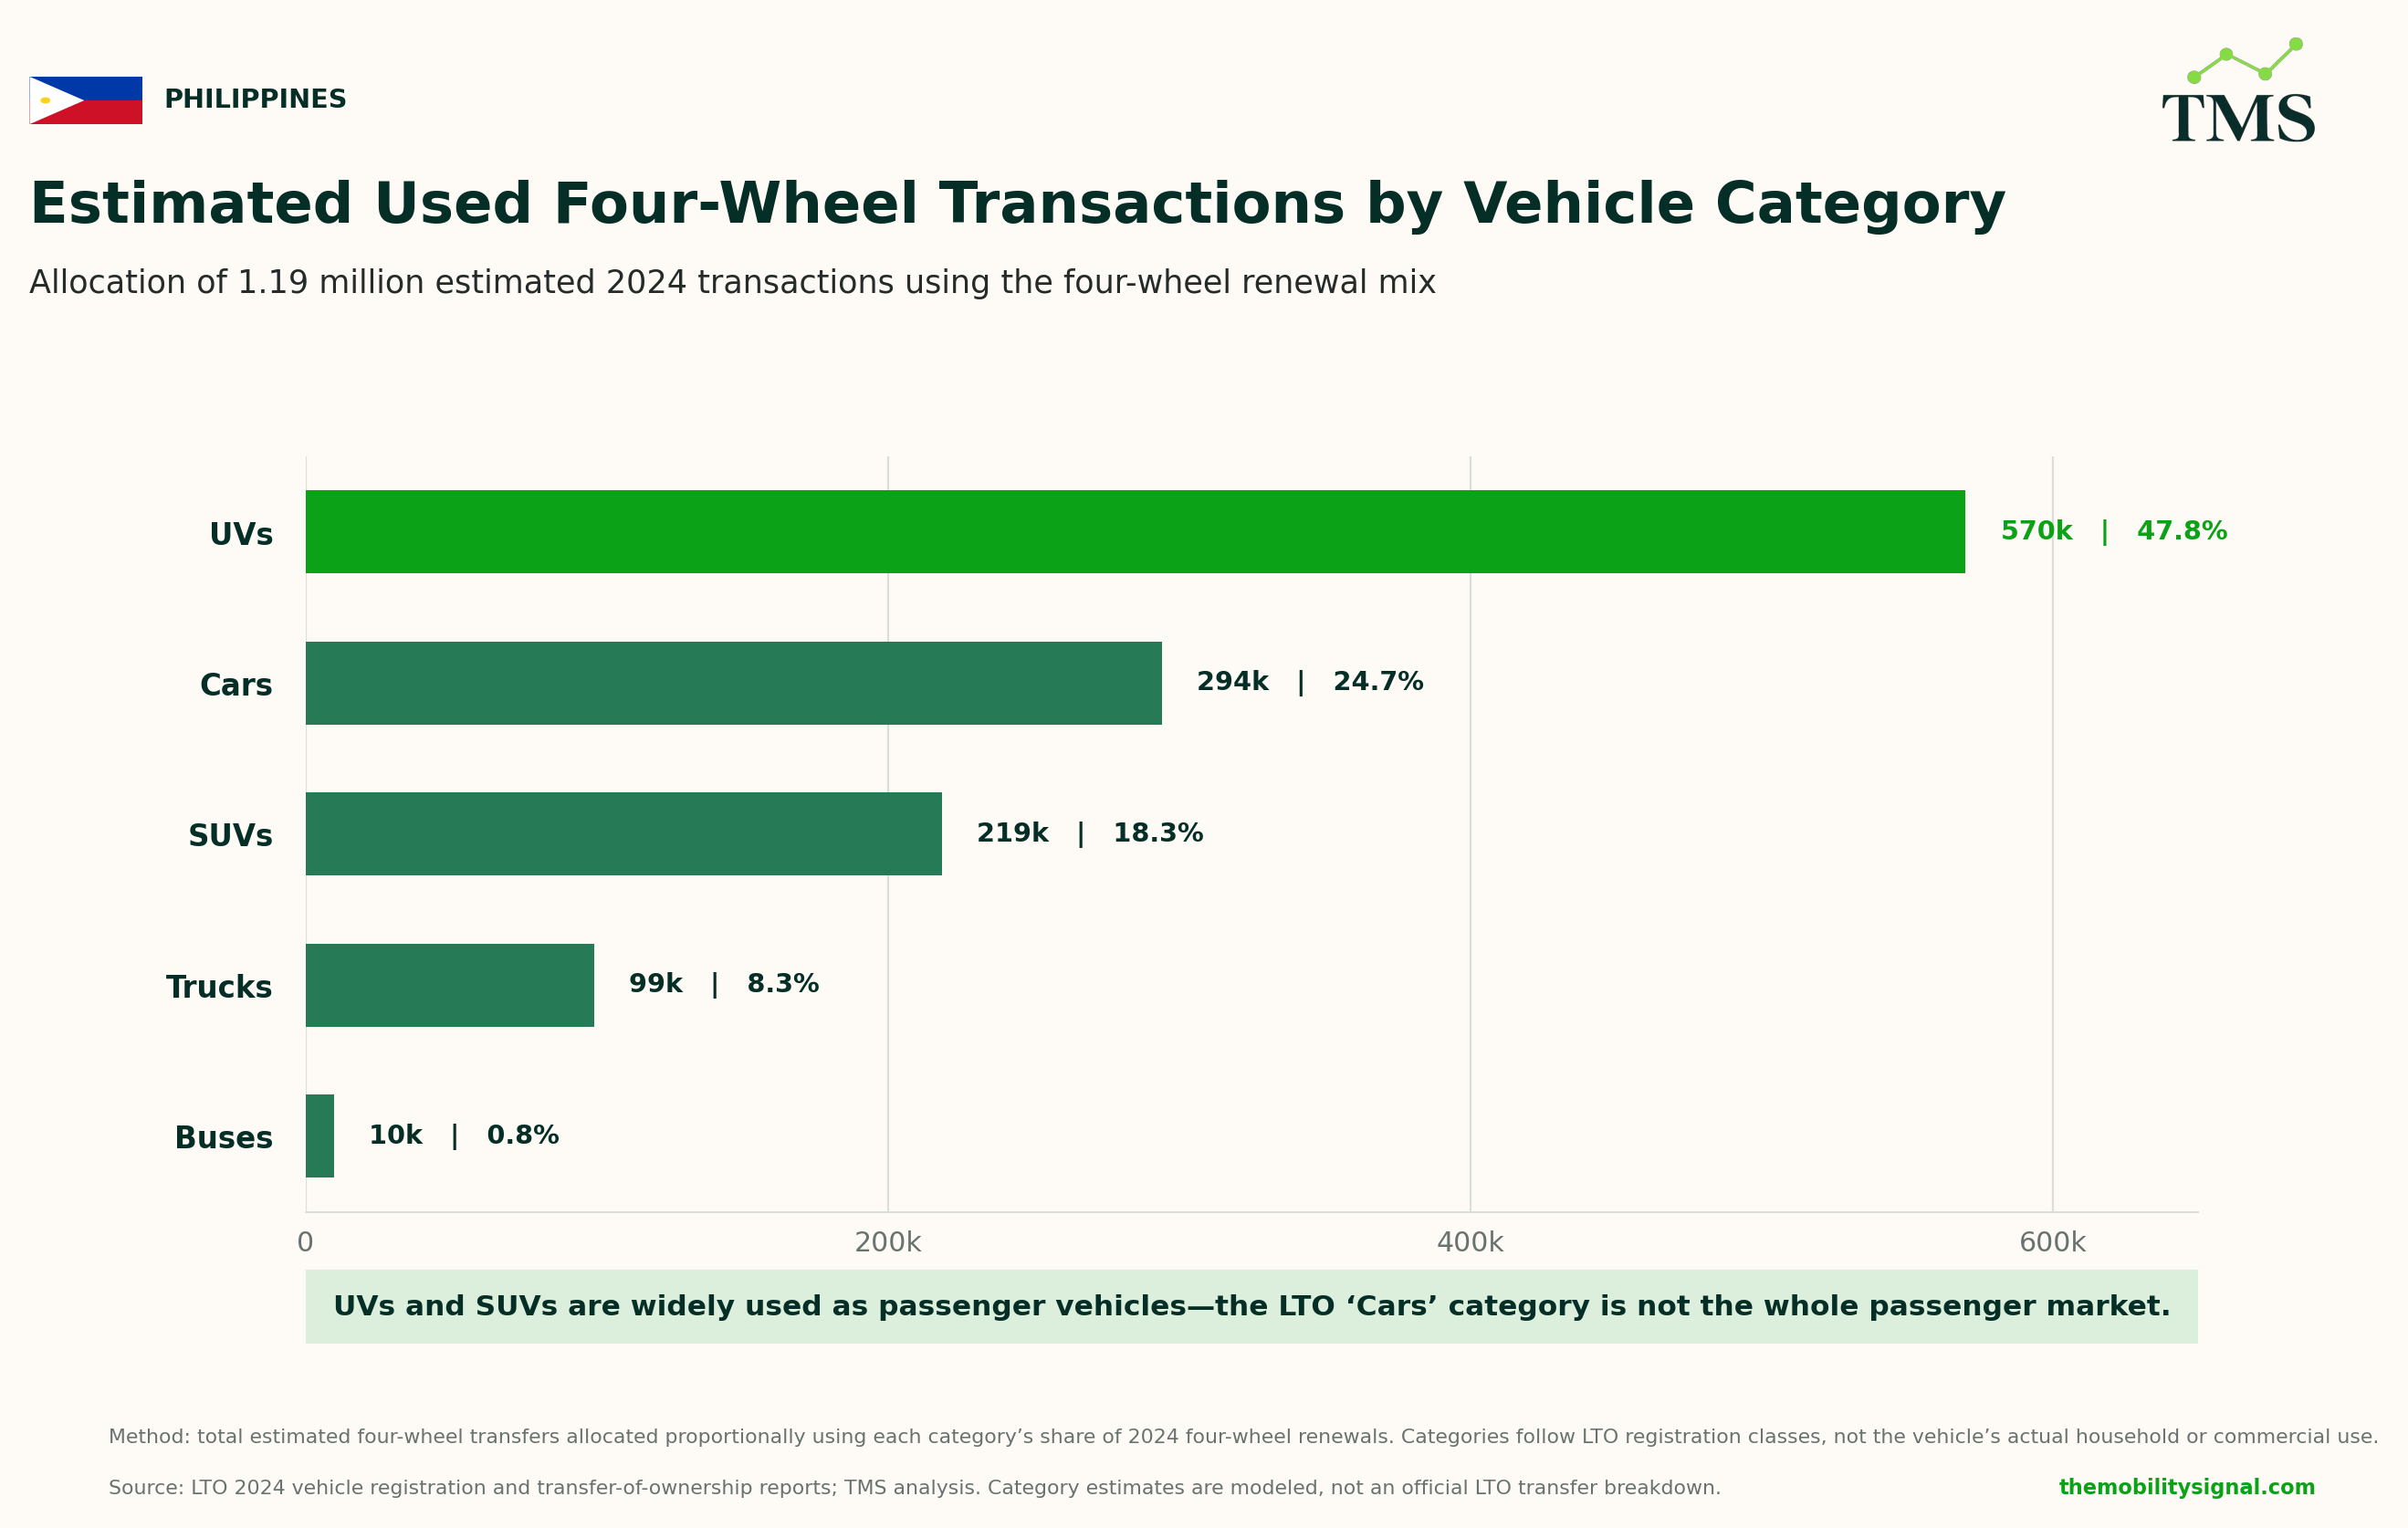
Whether we are looking at new or used vehicles, official classifications can be misleading. We cannot rely on the LTO cars category alone as many passenger vehicles are classified as UVs and SUVs, an issue we discussed when developing our framework for new vehicle sales.
So, we decided to take the broad four-wheel market and break it down by vehicle category as you can see below.
The main takeaway is that the growth of larger SUVs, MPVs and crossovers is also reflected in the used market. UVs and SUVs accounted for around two-thirds of estimated transaction activity, or around 789,000 transactions in 2024.
An estimated US $8.3B to $11.7B used four-wheel market
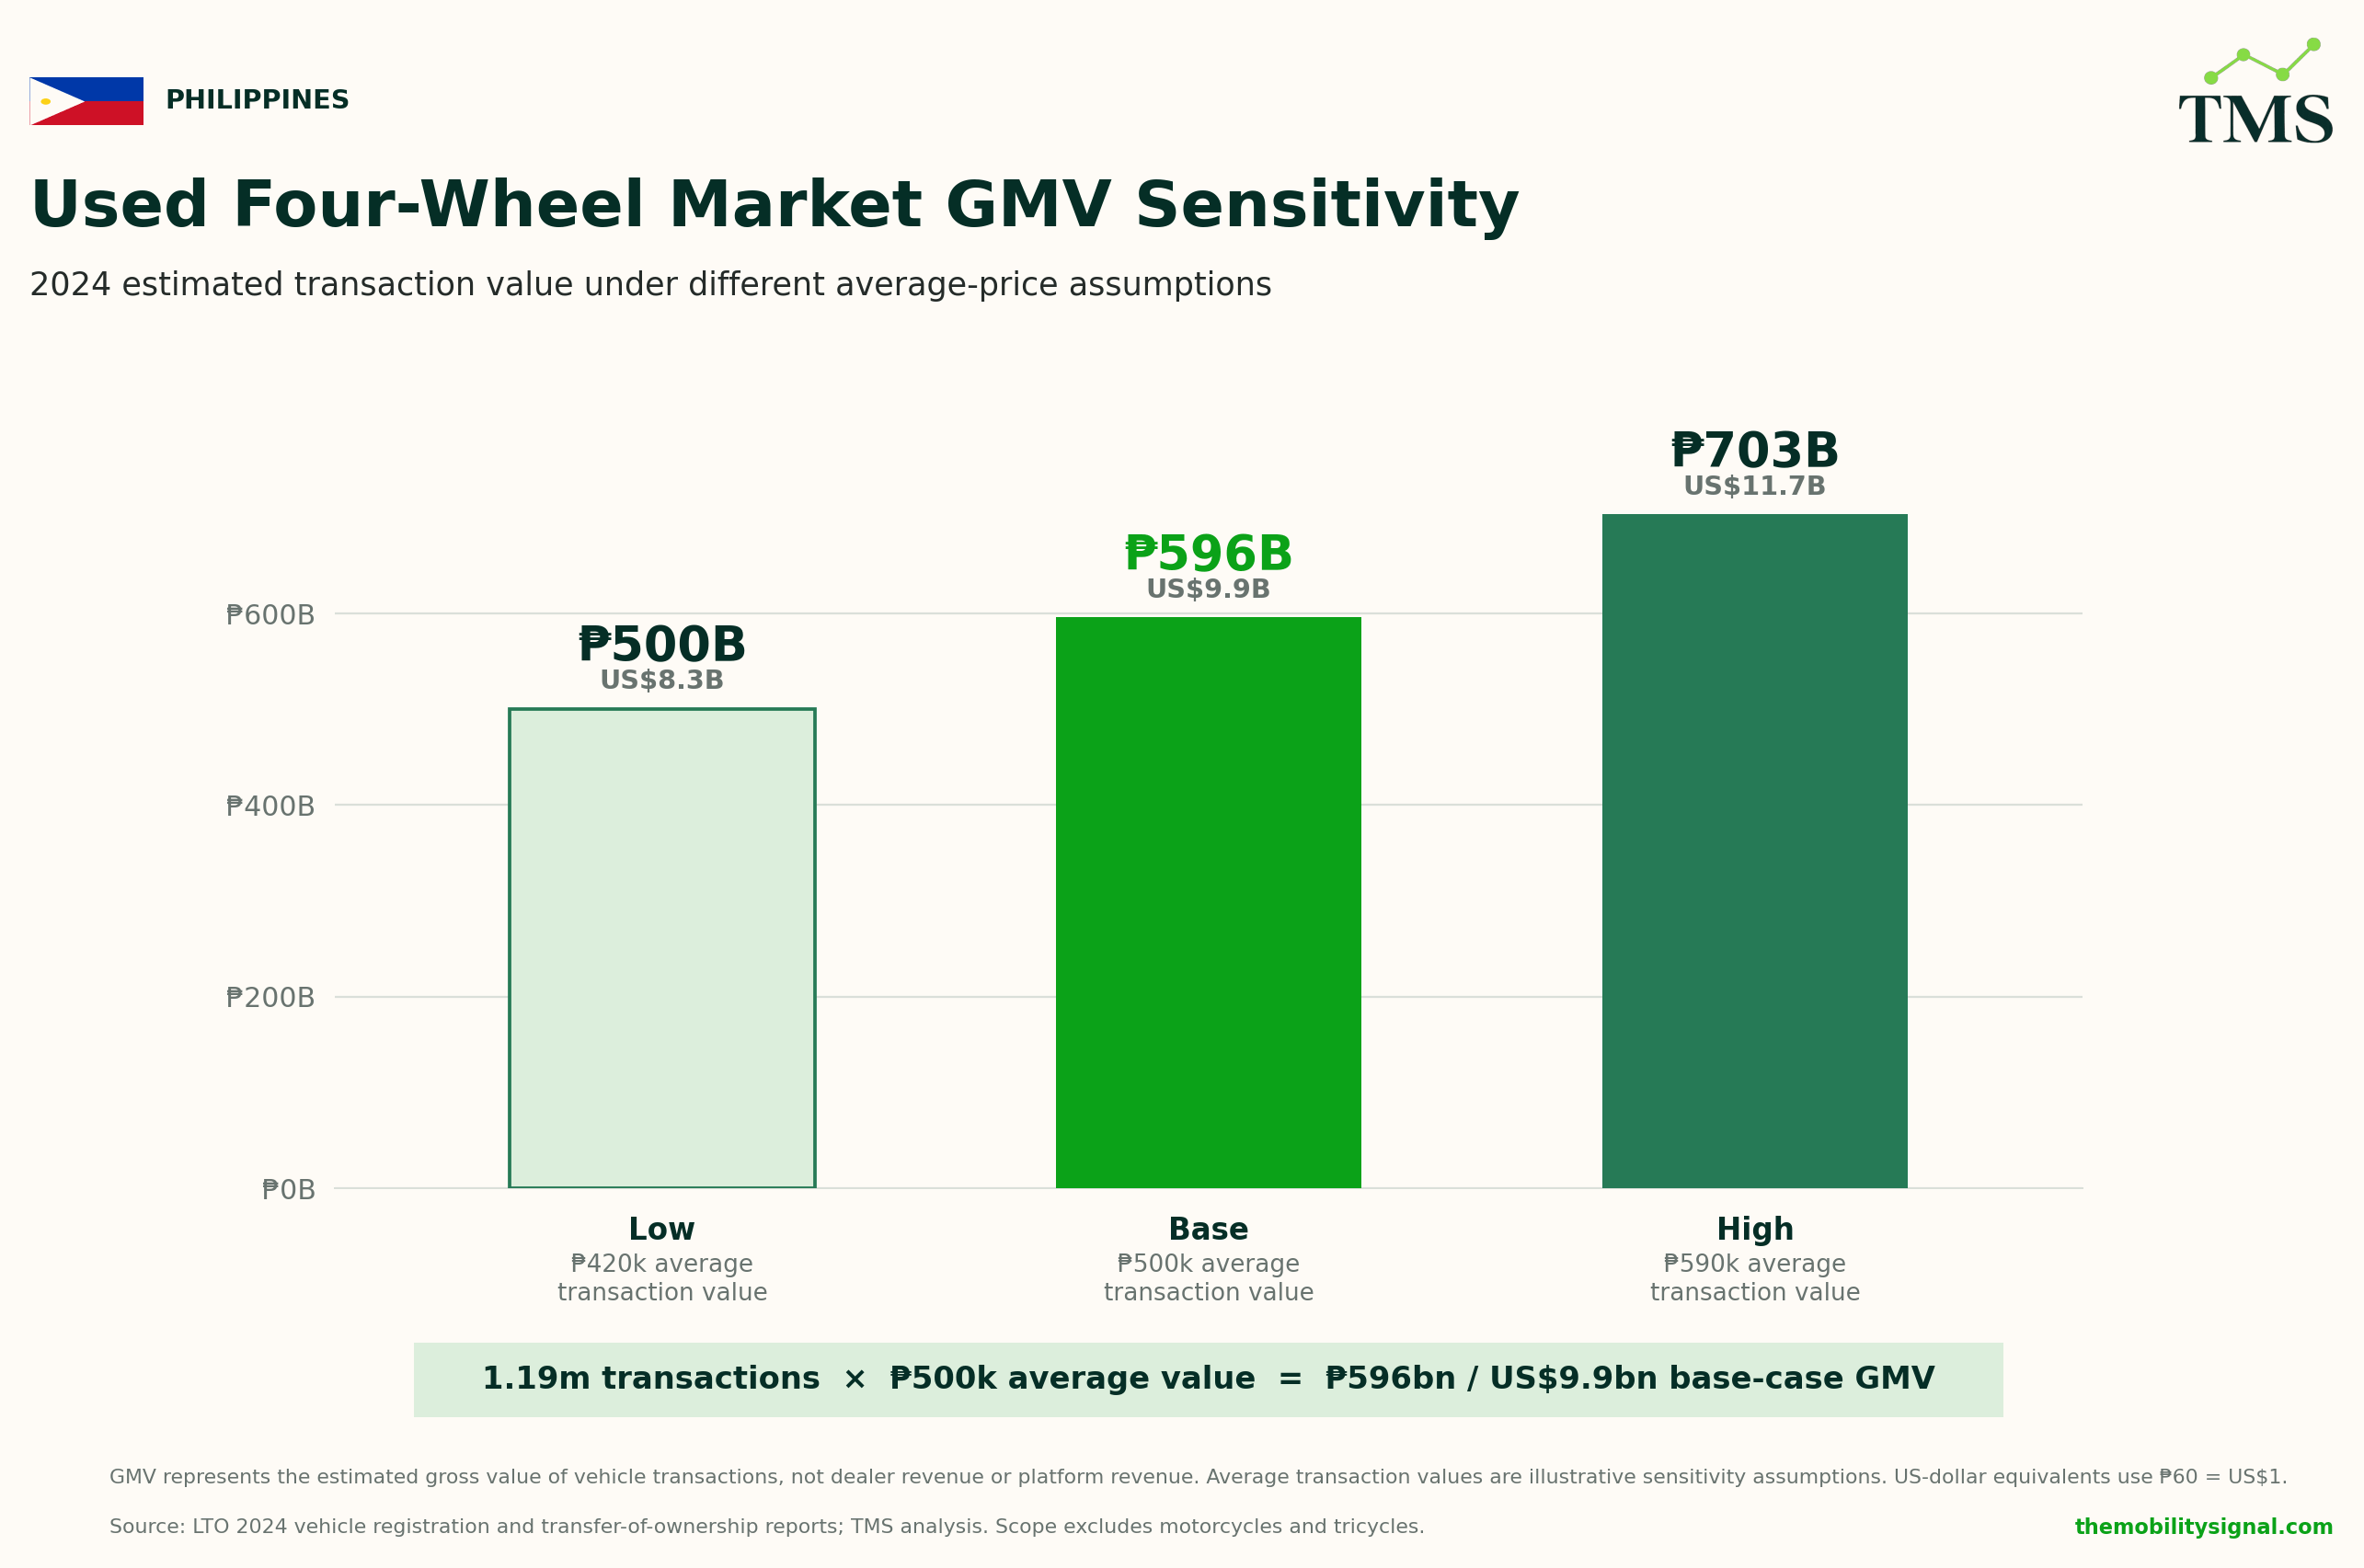
Now that we have an estimate of the number of transactions, we can begin to estimate the value of the market. The gross merchandise value (GMV) estimates the total value of the vehicles transacted, not dealer revenue, finance or marketplace revenue.
After reviewing listings across online marketplaces and Facebook, we looked at 3 scenarios, based on a low, base and high average transaction value, shown in the chart below.
Our base case assumes an average transaction of P500,000 and when multiplied by the estimated number of transactions, gives an approximate value of P596 billion, or US$9.9 billion at an exchange rate of P60 to US$1.
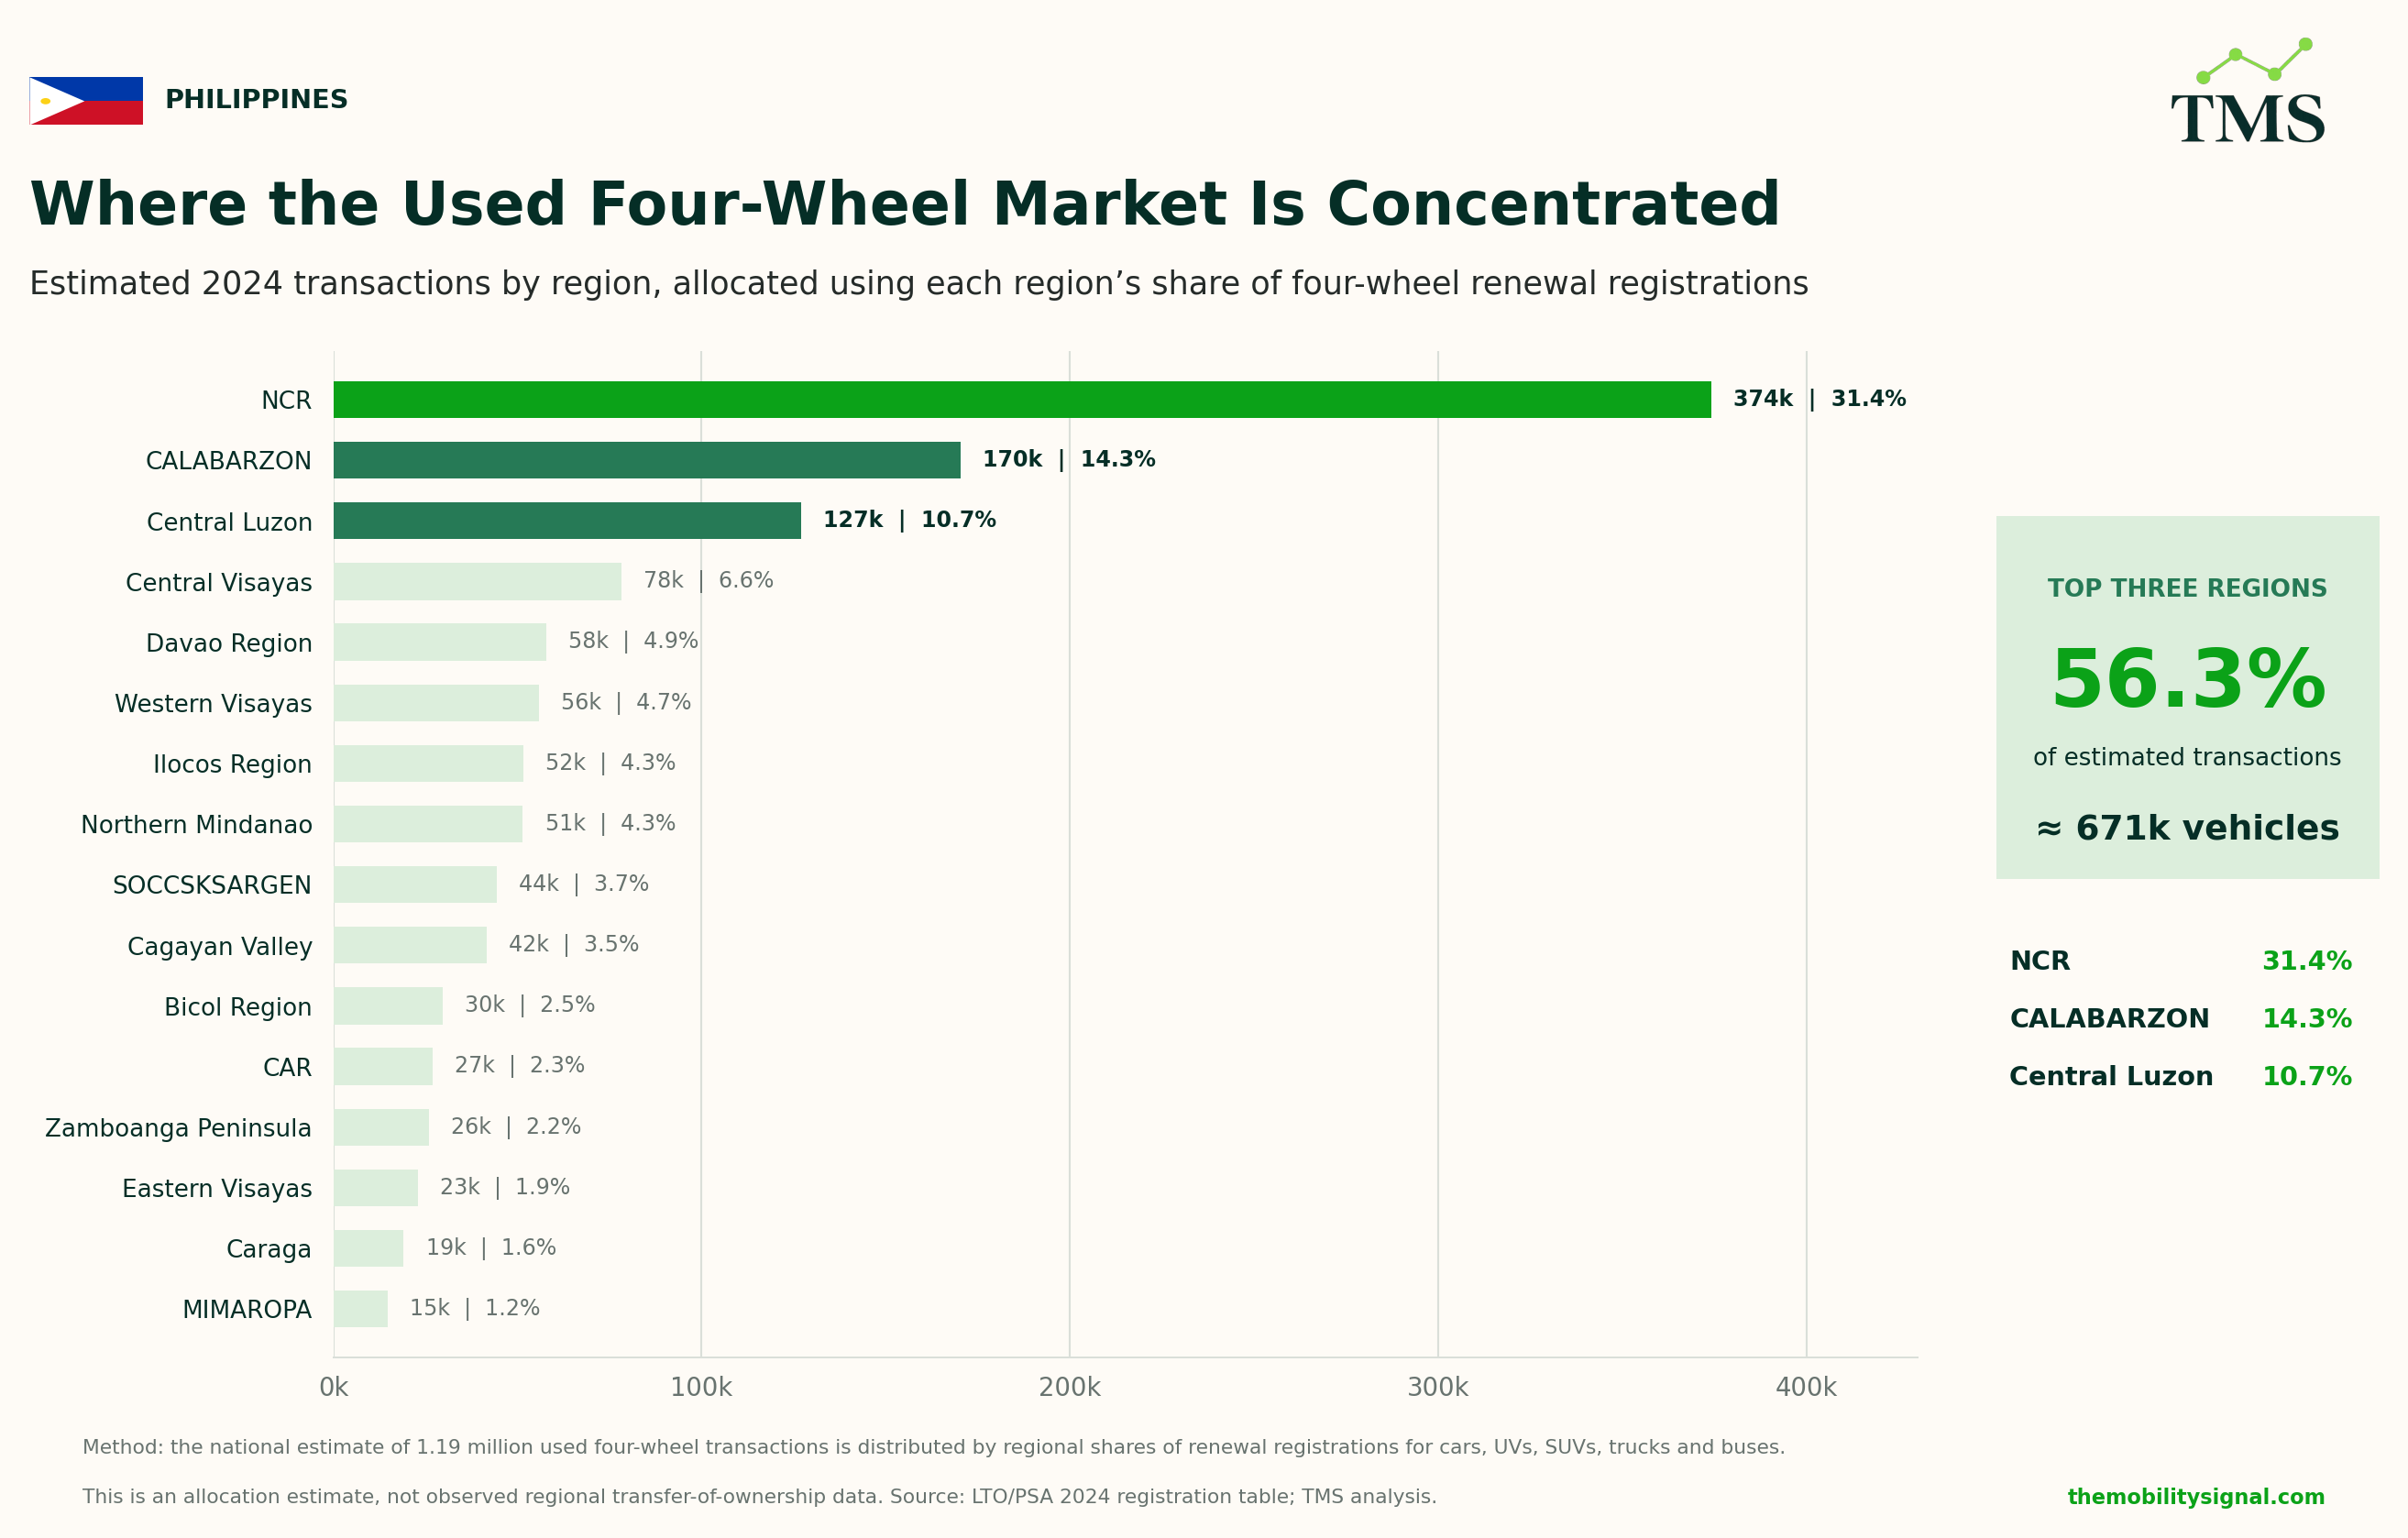
More than half of estimated used-market activity is concentrated in Luzon.
Luzon is home to the nation’s capital, Metro Manila, together with the surrounding regions of Central Luzon to the north and CALABARZON in the south. These three regions accounted for 56.3% of all estimated used four-wheel transactions in 2024.
For businesses involved in the used car market, this concentration is important when deciding where to focus. It has implications for where dealers expand, how marketplaces acquire inventory, where vehicle inspection and logistics are deployed, and how used car financing and insurance products are distributed around the transfer of ownership process.
Used four-wheel growth reflects both a larger vehicle base and higher turnover
The continued expansion of the used four-wheel market is driven by two key factors:
A larger pool of vehicles entering the resale market from the new car market.
A higher level of ownership-transfer activity.
So, we have an expanding renewal base, with more vehicles becoming available for resale, alongside an increase in the turnover rate. These two factors explain why used four-wheel transactions have grown faster than the renewal base.
A larger renewal base supports the used market
As the graphic below shows, the broad four-wheel renewal base grew from 3.37 million in 2015 to 5.33 million in 2024, a 58% increase. This expansion reflects the accumulation in new vehicle registrations over the period, which then gradually flow into the renewal base and eventually into the resale market. There is a time lag in this flow as many new vehicles are financed over 3-5 years. A vehicle registered in 2024 may not enter the resale market until 2029.
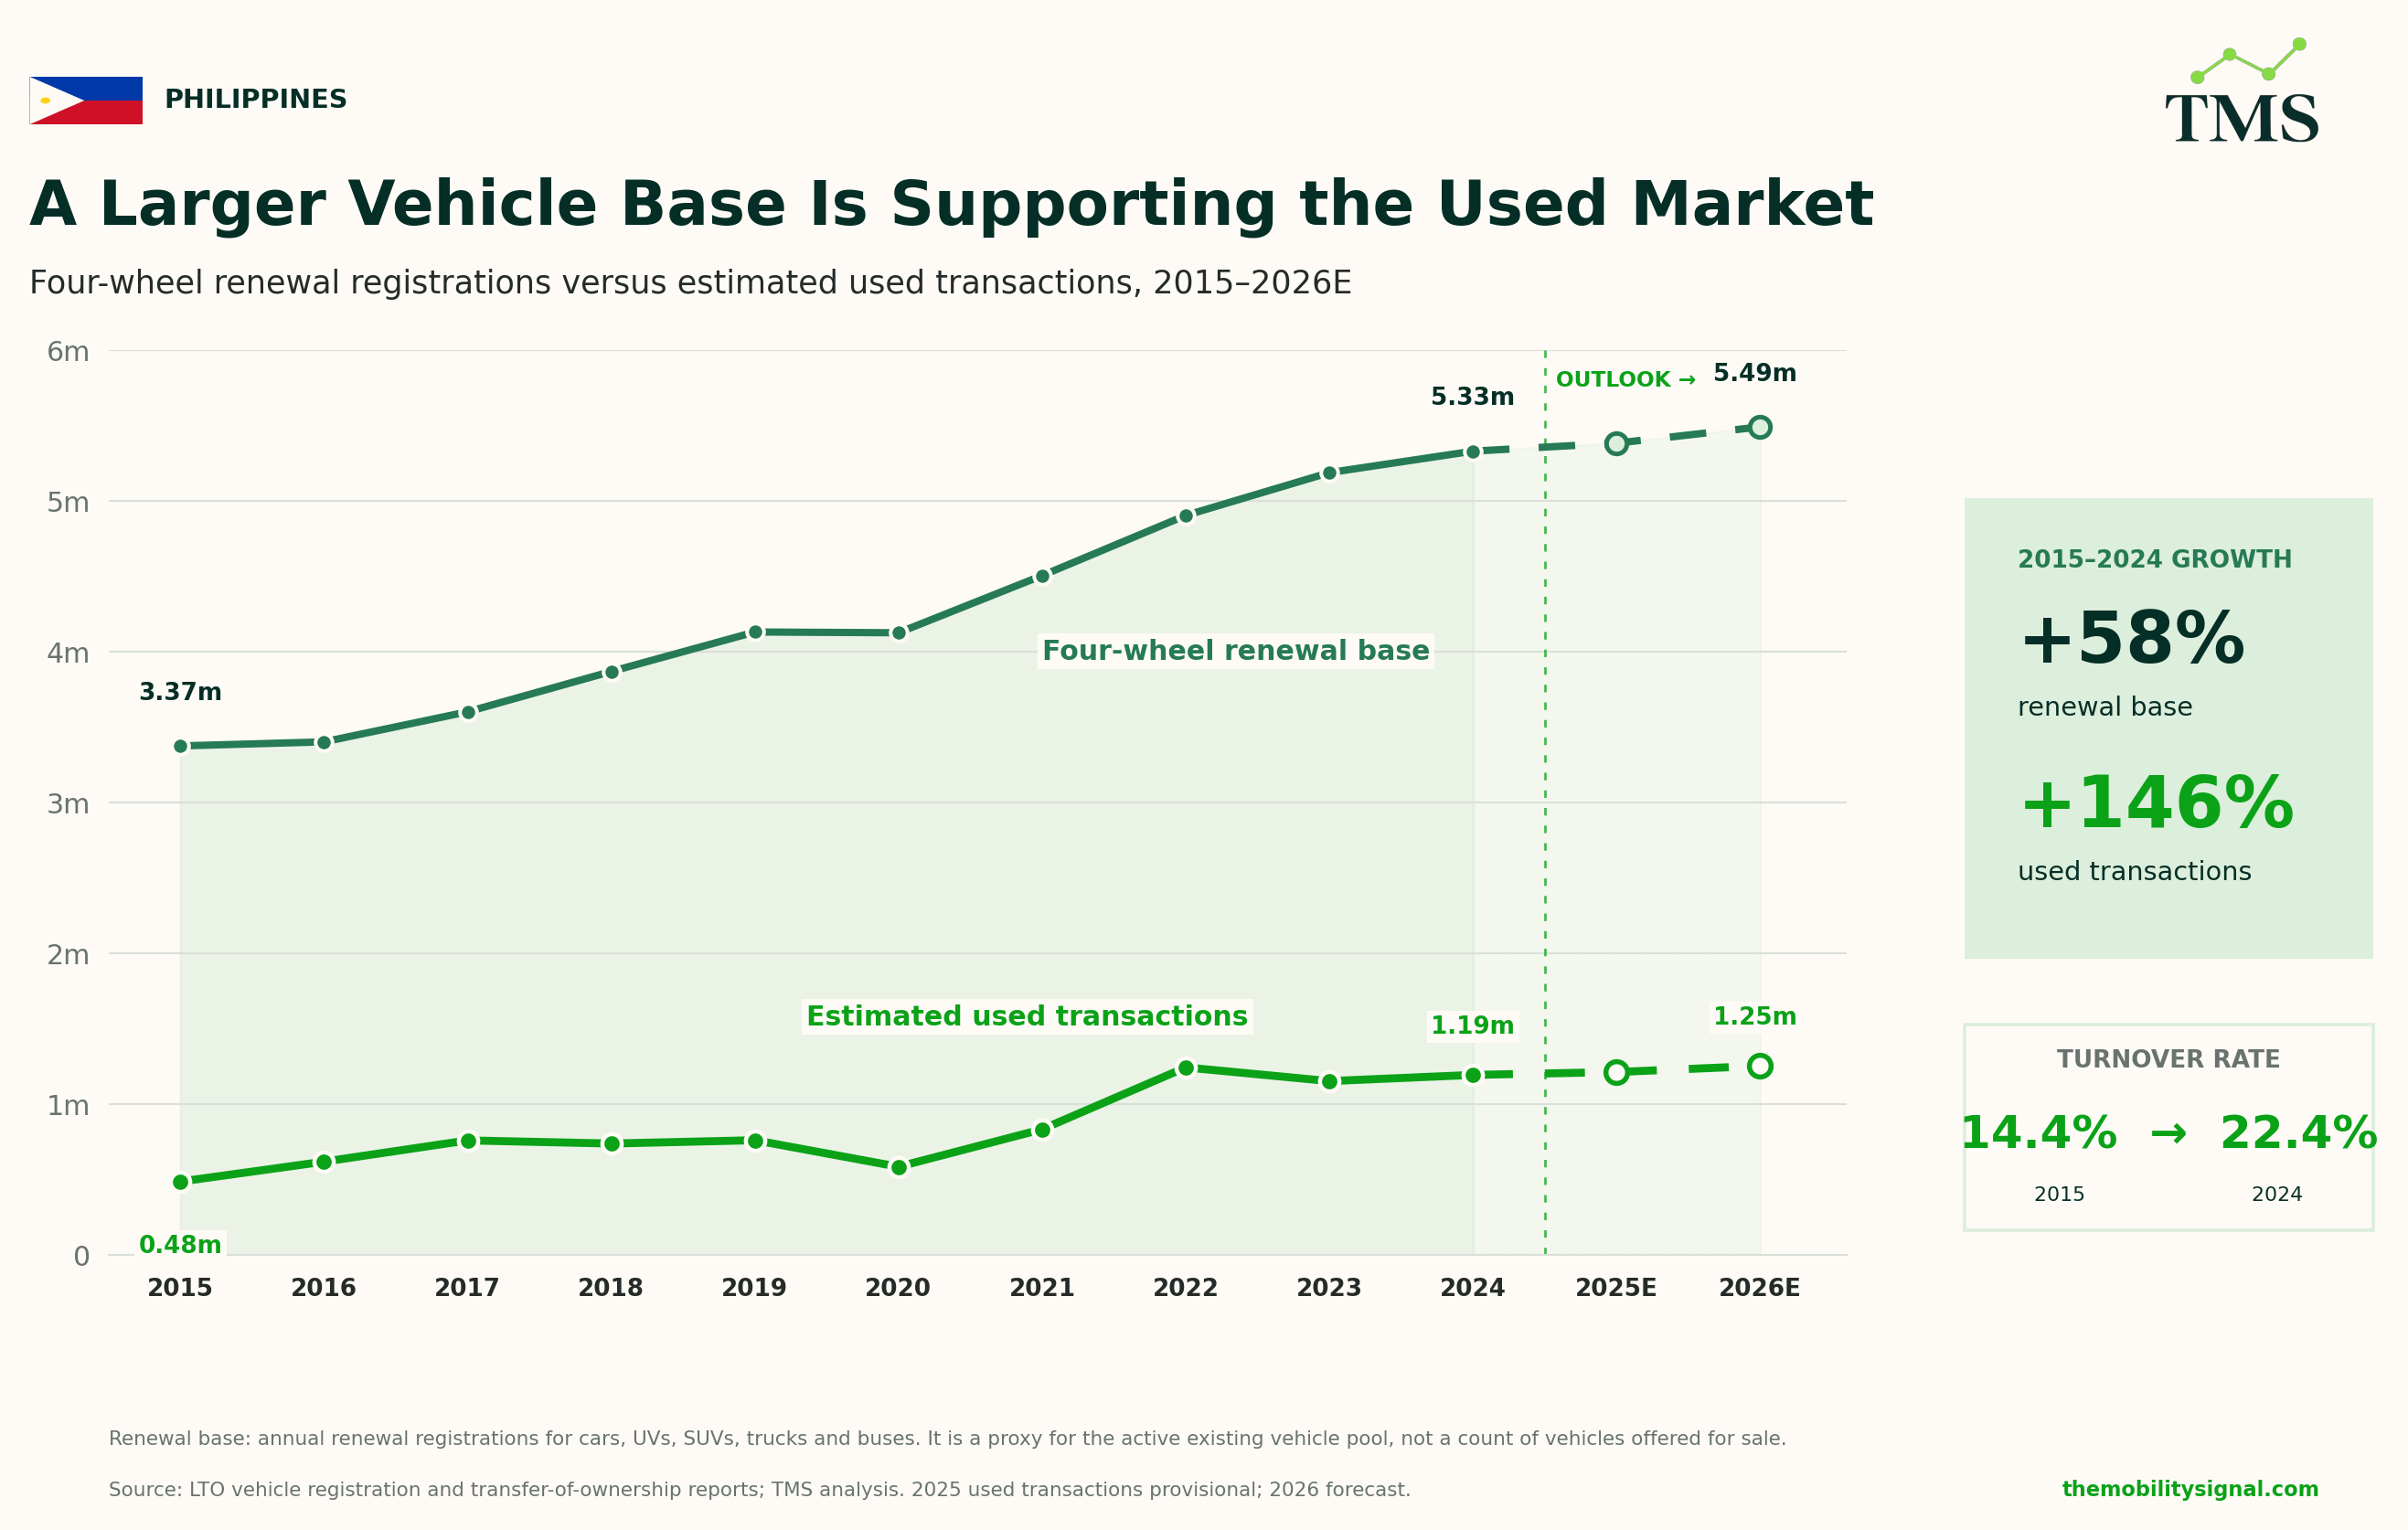
What’s interesting about these growth figures is that the larger renewal base can’t explain the growth in used transactions alone. If the turnover rate of 14.4% had stayed the same throughout this time period then 2024 used four-wheel transactions would have only reached 767,000, not 1.19 million.
5,327,731 x 14.4% = 767,193
Approximately 425,000 transactions in the 2024 estimate are associated with the higher turnover rate, beyond what renewal-base growth alone would have produced.
Why is more of the renewal base changing hands?
As the chart below shows, the turn over rate has increased from 14.4% in 2015 to 22.4% in 2024. This means that for every 100 four-wheel renewals, we estimate around 22 vehicles changed ownership.
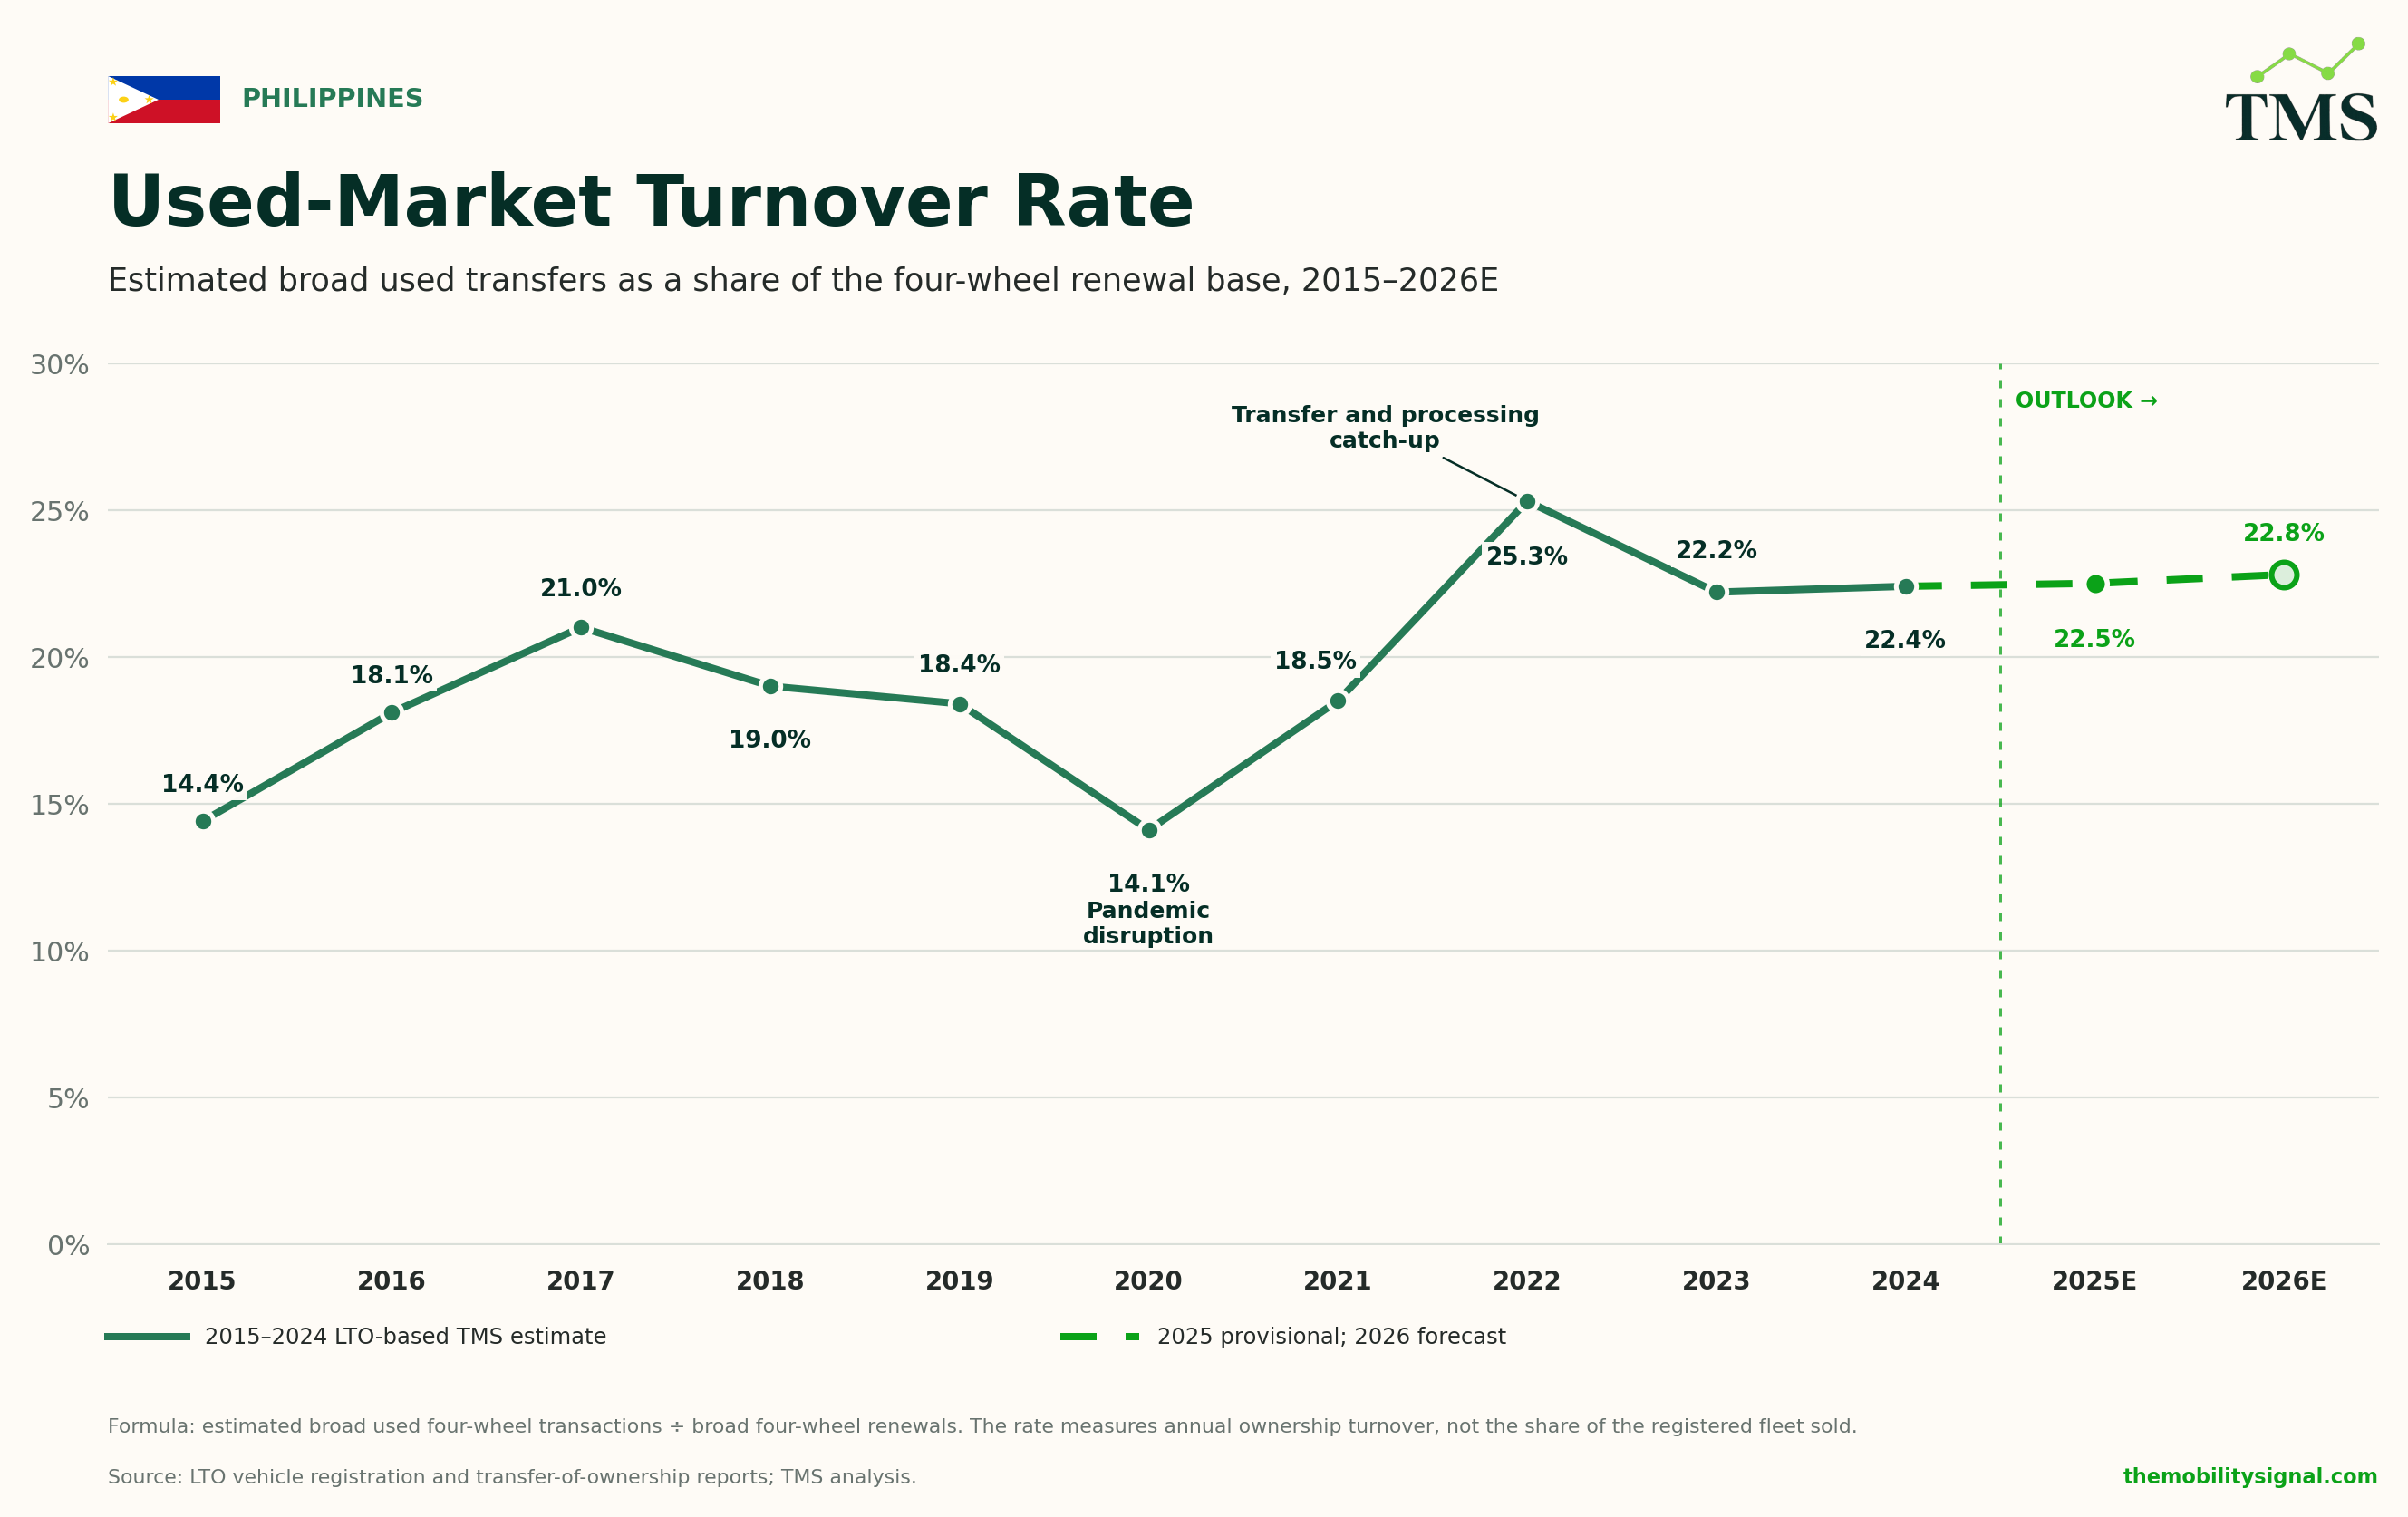
The increase in turnover rate of used transactions may be driven by a number of factors:
More mature second- and third-owner markets
Vehicles already in the used market are less likely to have long-term financing associated with them. This may allow them to move more quickly from a second owner to a third owner, increasing the frequency of used transactions.
Greater access to used-vehicle financing
Increased access to financing in both the new and used car markets can support higher used vehicle turnover:
It enables more buyers to purchase a used vehicle.
Allows existing owners to replace their vehicles sooner.
Increased new car financing generates more trade-in activity, for the used market.
Used car dealer financing has become more accessible, helping dealers to carry and sell more inventory.
A more organized resale market
Over the last 10 years, the used market has become more professional, with more sophisticated independent dealers, online marketplaces and financing intermediaries, helping to match buyers and sellers.
Better price and inventory discovery, dealer communication, documentation, embedded finance and insurance all reduce the time and effort to purchase a used vehicle, which in turn encourages vehicles to change owners more frequently.
More replacement and trade-in options
As discussed earlier, a growing new vehicle market can stimulate the used vehicle market as well as expand the overall vehicle base.
When existing vehicle owners want to purchase a new vehicle, they need to dispose of their current vehicle. There are now more options than in 2015, with owners able to trade-in via a new car dealer, sell directly to another buyer, sell to an independent used car dealer or transfer the vehicle within their family or business.
More formal registration and transfer processing
We also need to consider that the recording of transactions may have improved over time, with better compliance contributing to the increase in the reported transfer rate. This may include:
Better compliance with transfer-of-ownership requirements
Improvements in LTO processing capacity
Resolution of previously delayed transfers
Administrative campaigns encouraging owners to update registration records
Changes in reporting completeness across LTO offices
These are plausible contributors to higher turnover, but the available public data do not allow us to measure the effect of each factor individually.
The used-vehicle market is becoming more important relative to the new market
In 2015 the new and used four-wheel markets were similar in size: for every new four-wheel registration, there were 1.18 used transactions.
The used four-wheel market now generates more than two used transactions for every new four-wheel registration.
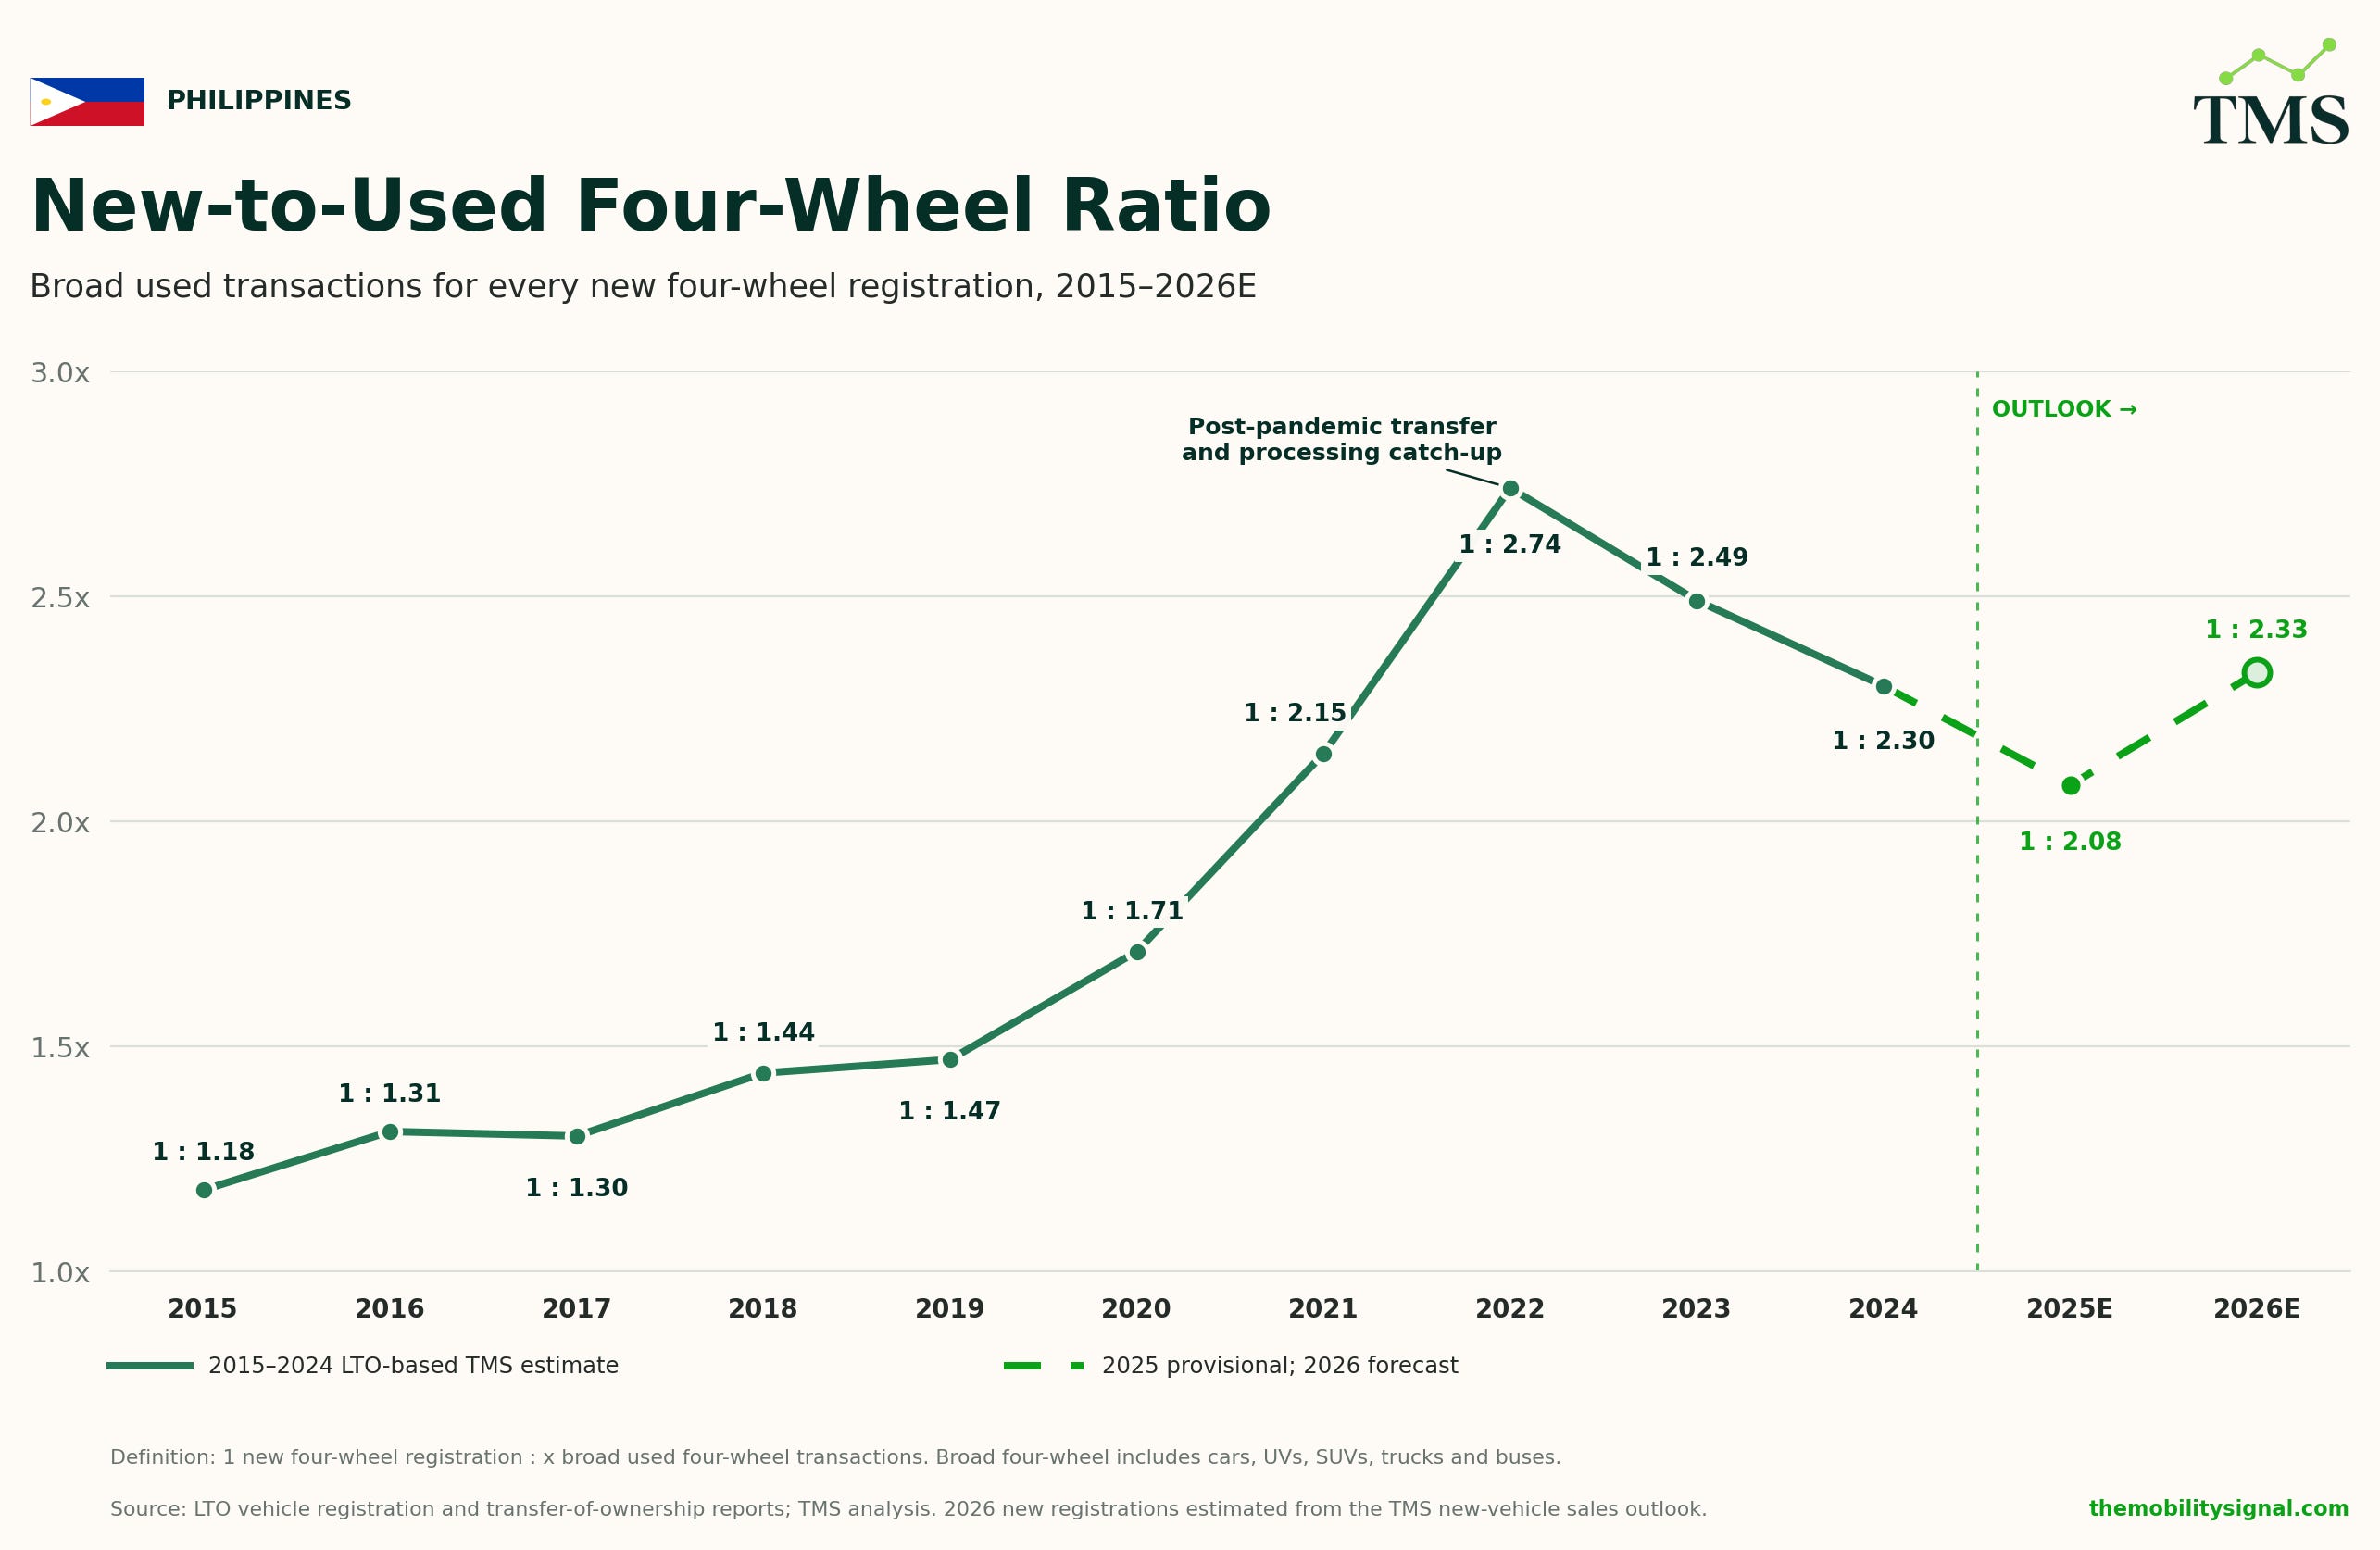
The decline in the ratio after its 2022 peak, most likely reflects the rebound in new car registrations and the normalization of ownership-transfer processing following the post-pandemic catch-up. We view this as normalization, rather than a weakening of the used market, with used transactions stabilizing at more than twice the level of new registrations.
Strong new vehicle sales point to rising future supply of used vehicles
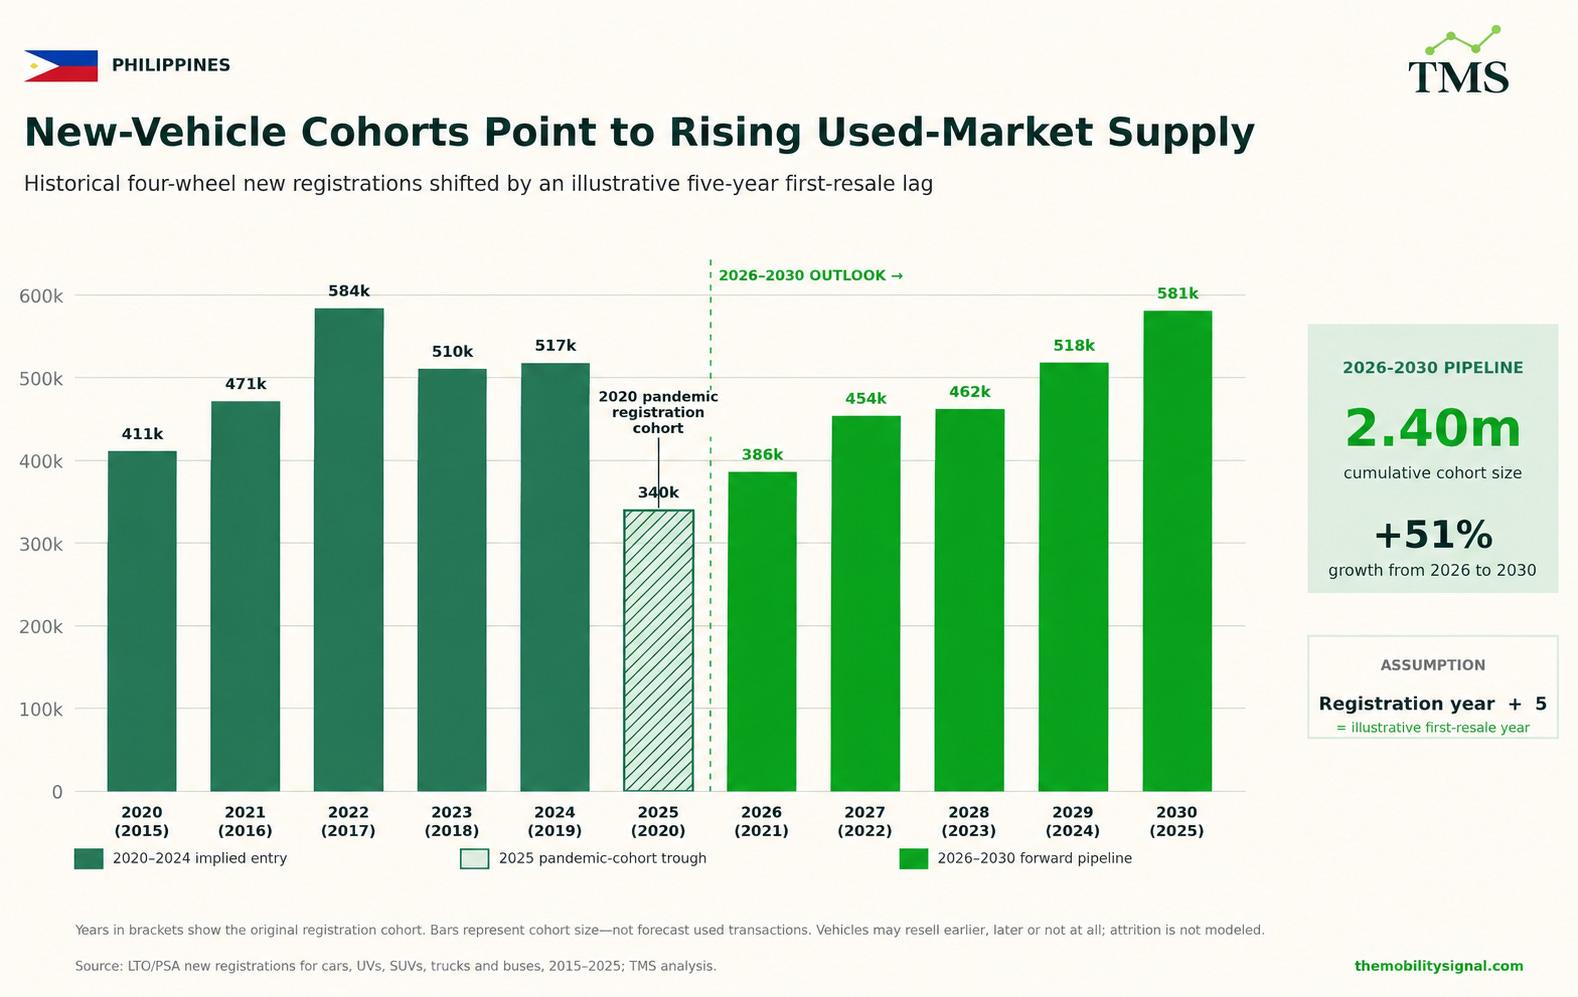
New four-wheel registrations fell significantly in 2020 and remained subdued in 2021. As most new vehicles are financed through a five year loan, TMS uses an illustrative five-year lag to show when these vehicles may begin entering the used market. This points to lower potential supply in 2025 and 2026.
New vehicle registrations recovered strongly between 2022 to 2025. This represents approximately 2 million vehicles entering the used market from 2027 through to 2030. Including the 2021 new vehicles registered, the total 2026-2030 pipeline comprises approximately 2.4 million vehicles.
The 2026-2030 used market outlook
The Philippine used four-wheel market should remain above 1.2 million transactions as we move into 2027, with continued strength as the post-pandemic new vehicle cohort gradually flows into the used market.
For 2025 we estimate a slight increase in used four-wheel transactions from 1.19m in 2024 to around 1.21 million, an increase of 1.5%. Even though the new-to-used ratio declined from 1:2.3 to 1:2.08, this reflects the strength of the new vehicle market in 2025, rather than a contraction in used market transactions.
In 2026, we have seen a softening of the new vehicle market amid difficult economic conditions. This may create more resilient conditions for the used market, supported by an increase in vehicle inventory and demand from consumers looking for greater affordability. The rapid shift towards electrification that took place in H1 2026 could also generate more trade-ins. TMS uses 1.25 million transactions as a conservative 2026 base case, equivalent to growth of around 3.3% and a new-to-used ratio of approximately 1:2.33. This may change if economic conditions place further pressure on household finances.
The Philippine used four-wheel market is not a small, overlooked little brother to the new vehicle industry, but a significant automotive economy in its own right. In 2024 the market sat at approximately 1.2m transactions per year and a GMV of around US$10 billion.
The future looks strong as we look beyond 2026, creating substantial opportunities for dealers involved in sourcing and trade-ins; marketplaces providing transactions and lead generation services; lenders offering used-vehicle financing; insurers providing CTPL and comprehensive insurance; and OEMs with certified-used vehicle programs.
For investors, it represents a major opportunity to support financing, insurance, inspections, warranties and marketplaces trying to orchestrate the consumer layer.
Methodology and limitations
Market definition
The broad four-wheel market comprises the following LTO registration categories:
Cars
Utility vehicles (UVs)
SUVs
Trucks
Buses
Motorcycles, tricycles and trailers are excluded from the estimated four-wheel market.
Total vehicle registrations
LTO vehicle registrations totaled 14,619,753. This figure can be broken down into three main categories:
Four-wheel - 5.846m
Two/Three wheel - 8.710m
Trailers - 0.064m
Registrations are not sales, as they include both newly registered vehicles and annual renewals of vehicles already in the registered population.
Separate new vehicle registrations from renewals
In 2024 LTO recorded 2,564,083 new registrations across all vehicle classes. If we subtract total new vehicle registrations from total registrations gives us the renewal population.
Total renewal population = 14,619,753 - 2,564,083 = 12,055,670
The resulting 12.06 million renewals are not a measure of used-vehicle transactions, but represents vehicles renewing their registrations.
Calculating ownership-transfer rate
LTO officially recorded 2,696,418 transfers of ownership in 2024. We calculated ownership transfers as a percentage of total renewals:
(2,696,418 total transfers / 12,055,670 total renewals) x 100 = 22.37%
This means that recorded ownership transfers were equivalent to 22.37% of total annual renewal activity in 2024.
Establishing the four-wheel renewal base
LTO recorded 5,845,762 broad four-wheel registrations in 2024. Of these 518,031 were new registrations, therefore if we subtract new registrations from the total gives us the total four-wheel renewal base:
5,845,762 - 518,031 = 5,327,731
Broad four-wheel vehicles therefore represented:
(5,327,731 / 12,055,670) x 100 = 44.19%
The remaining 55.81% mainly comprises motorcycles, tricycles and trailers.
Estimating used four-wheel transactions
1. Transfer rate approach: Apply the overall ownership-transfer rate of 22.37% to the broad four-wheel renewal base.
2,696,418 / 12,055,670 = 22.3664%
5,327,731 x 0.223664% = 1,191,620
This applies the overall transfer-to-renewal rate of 22.37% to the 5.33 million broad four-wheel renewals, giving us an estimated 1.191 million used four-wheel transactions in 2024.
2. Allocation approach: We can apply the broad four-wheel share of renewals, 44.19%, to the total number of ownership transfers of 2,696,418.
(5,327,731 / 12,055,6705) x 100 = 44.1927%
2,696,418 x 0.441927% = 1,191,620
Both formulas produce the same result of 1.19 million used four-wheel transactions, because they both allocate total ownership-transfers according to the annual four-wheel share of renewal activity.
Limitations
The estimate assumes that four-wheel vehicles experience the same average transfer-to-renewal rate as the wider registered vehicle population. The actual transfer rate may differ between motorcycles and four-wheel vehicles.
Recorded ownership transfers may also differ from underlying commercial sales because some transactions are not formally transferred, some transfers are completed after the underlying sale, and administrative backlogs can shift recorded activity between years.
The estimate should therefore be interpreted as a structured measure of recorded used-market activity rather than an official LTO count of used four-wheel sales.