


New here? Join The Mobility Signal for on-the-ground intelligence from Southeast Asia’s automotive and mobility markets, built for industry leaders, investors, private equity, venture capital and advisors who need to understand what is changing and what it means.
What can vehicle exports tell us?
We wanted to look at vehicle export data for the Philippines and see what relationships we could find with what Filipinos are actually buying. Can rising exports from particular country help signal future sales growth in the Philippines? And could some of today’s manufacturing hubs come under pressure as electrification or consumer preferences change?
Trade and customs statistics can tell us where vehicles are coming from, but they can’t tell us what vehicles the Filipino consumer actually purchased. Conversely retail sales tell us what Filipinos purchased but not where they were built.
And finding out the answer is not straight forward.
The vast majority of Toyotas and Mitsubishis sold in the Philippines are not manufactured in Japan, but across several Southeast Asia countries depending on the model. The Ford Territory is manufactured in China, while BYD’s vehicles are currently manufactured in China.
When we combine those manufacturing flows with Philippine retail sales, a more interesting story starts to emerge, especially around vehicle types, electrification and changing consumer demand.
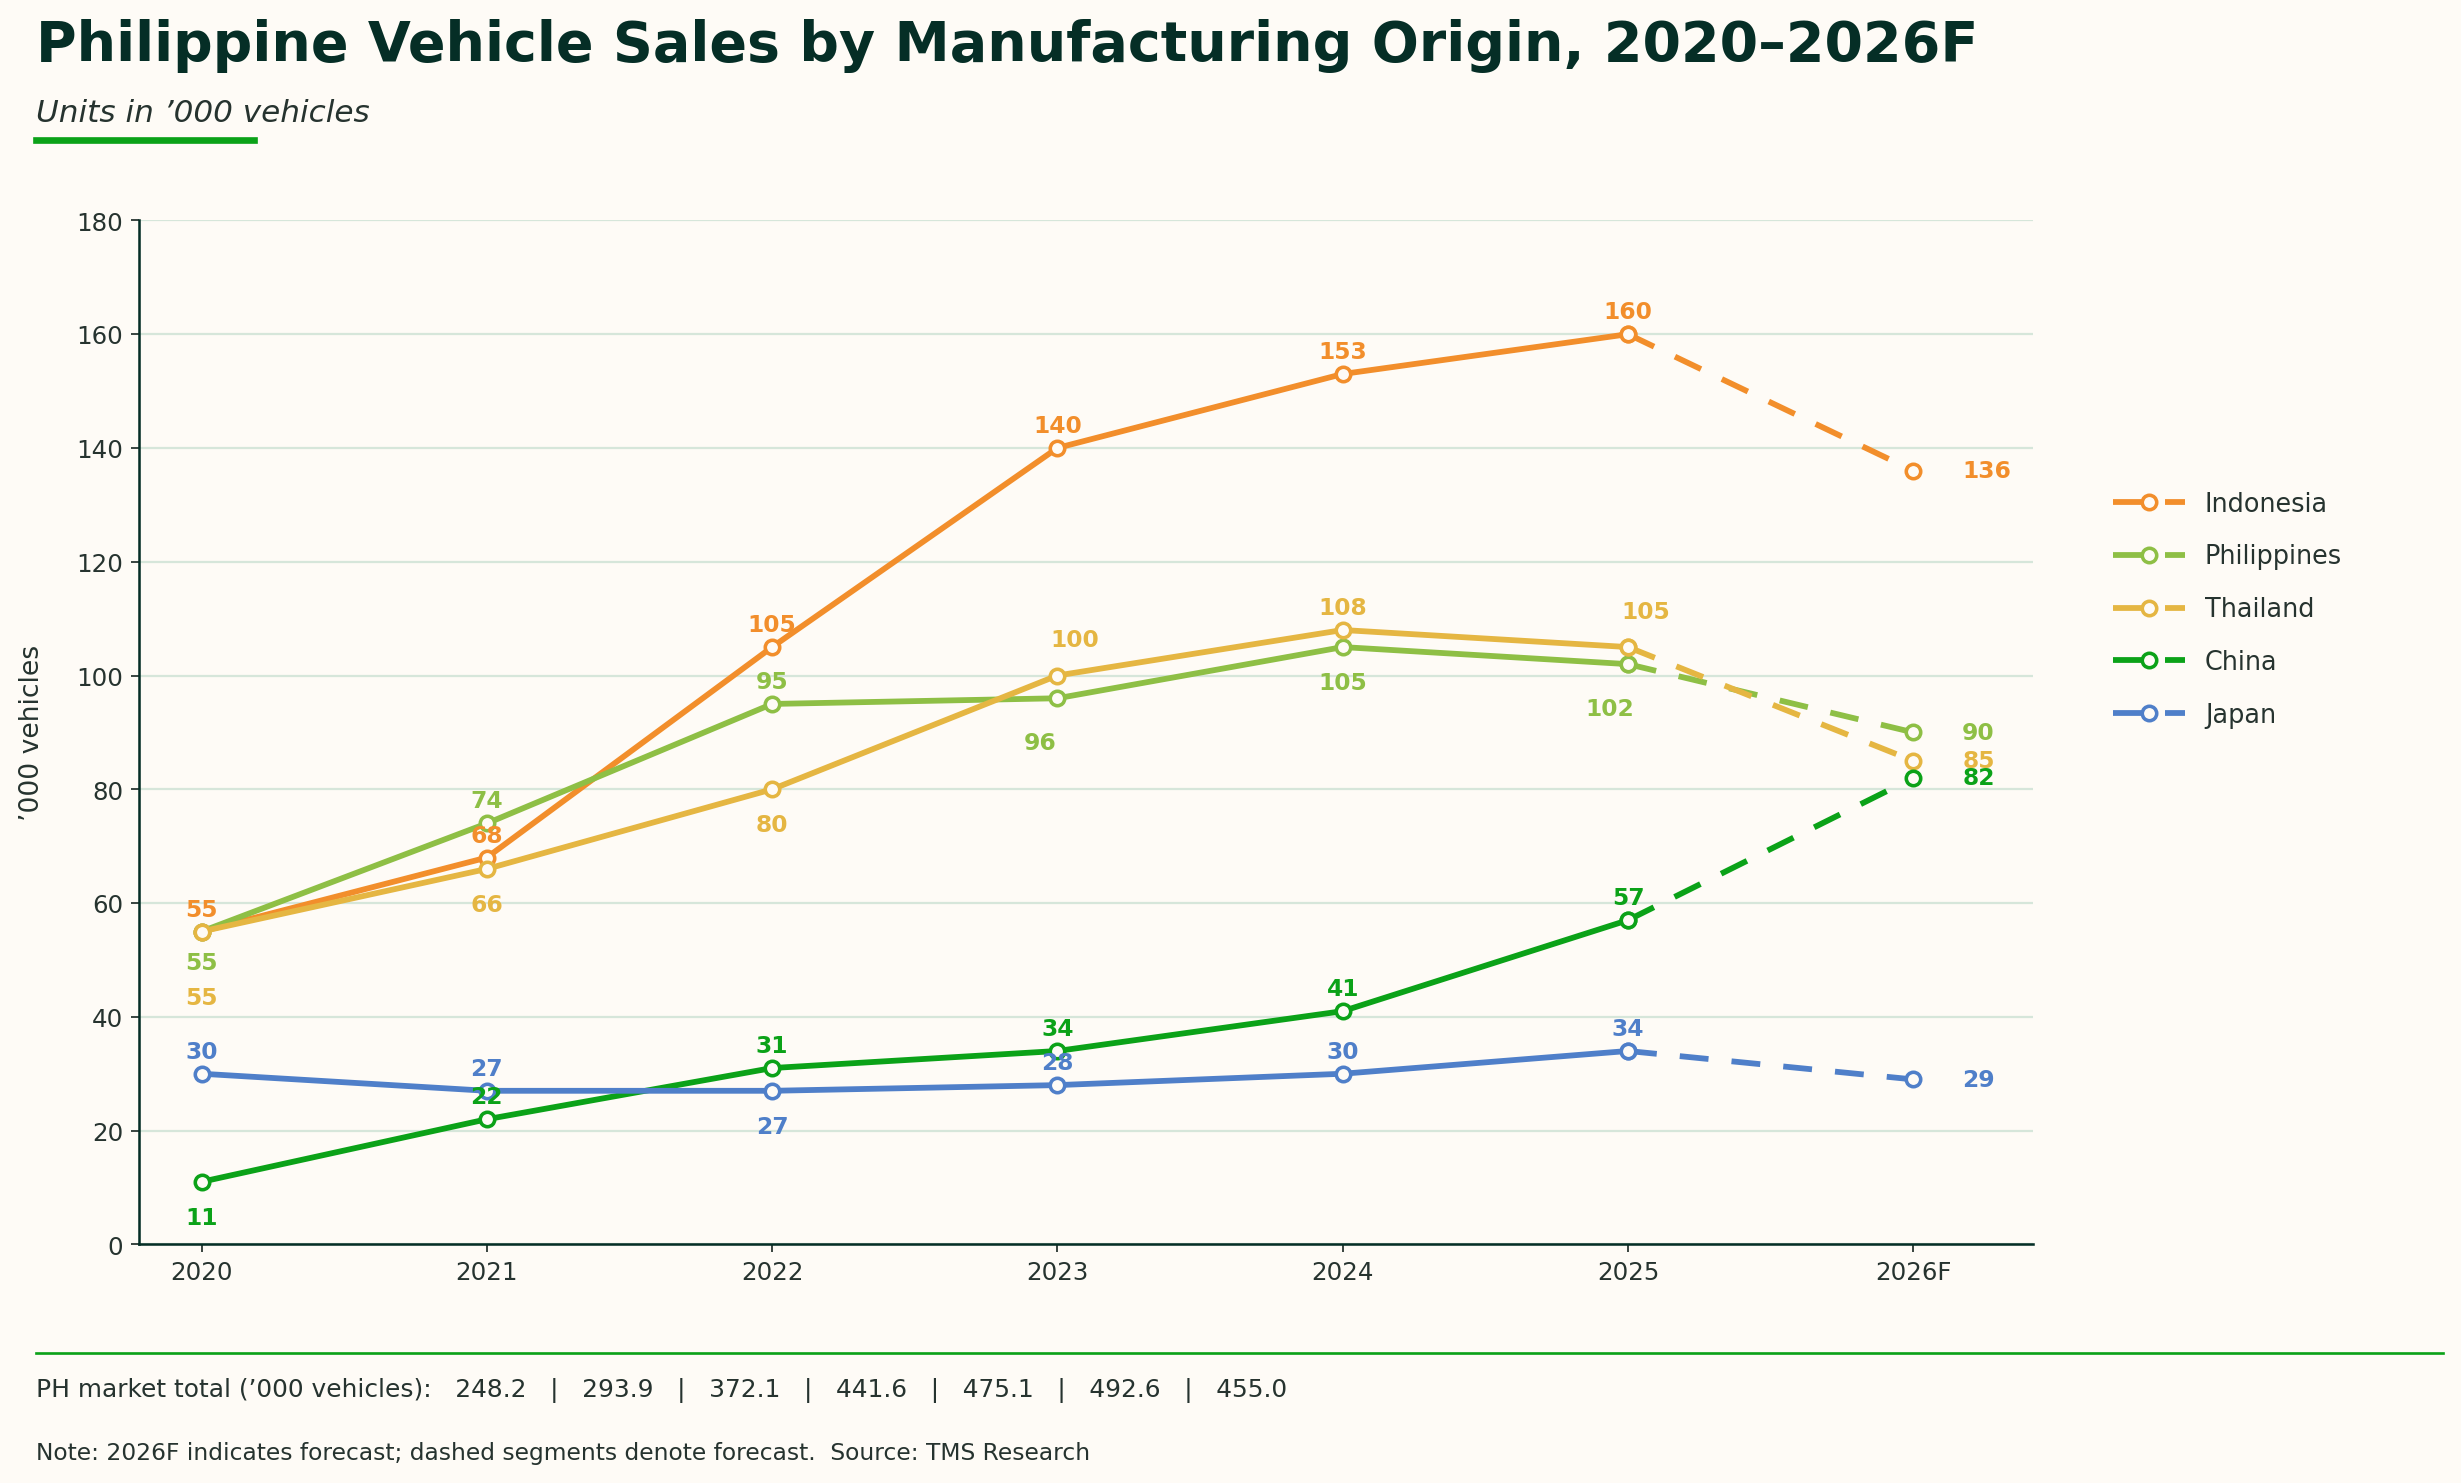
What stands out in the chart
Immediately we can see that Indonesia is the largest manufacturing source of vehicles to the Philippines, accounting for around 160,000 vehicles in 2025. Thailand and the Philippines as the next two major manufacturing hubs for Philippine vehicle sales, and it has been this way for over 5 years now. However from 2024 to 2025, for the first time in 5 years, Thailand and Philippine manufacturer numbers slightly declined.
The fastest growing manufacturing source is China, rising from around 11,000 to 57,000 China-built vehicle sales in 2025, and our current forecast estimating 82,000 in 2026, bringing them into the realms of Thailand and Philippine production numbers.
The other noticeable realization was that even though there are 40 plus brands and hundreds of models in the Philippines, 86% of all vehicles sold come from 4 key manufacturing hubs in Indonesia, Thailand, the Philippines and China.
The question that arises from all this is;
Why is the manufacturing map starting to change, and how closely is that reflecting in what consumers are buying?
Before we look into the answers around that question we need to look at the problem we needed to solve, which mainly focused around the fact that vehicle exports, vehicle production and vehicle sales are not the same thing.
The first problem: exports are not sales
There is no single Philippine dataset showing how many vehicles sold locally came from each manufacturing country. Trade data tell us when vehicles cross the border, manufacturers report how many vehicles their factories produce and industry associations and distributors tell us how many vehicles dealers sell.
But these are three distinct data points in the supply chain, and don’t translate into one-for-one vehicle sales data.
Customs arrival ≠ retail sale
A vehicle may arrive from Indonesia in December and remain with the distributor until January or February, before being sold. Customs record the vehicle in one calendar year, while the industry sale is recorded in the next.
China shows why the gap can be much larger
Chinese automotive export statistics report 148,727 vehicles exported to the Philippines during the first half of 2026, enough to rank the Philippines among China’s ten largest automotive export destinations.
This number initially looks extraordinary as there were only around 222,000 vehicles in total sold in the Philippines during H1 2026, and we estimate roughly 40,000 were China-built.
To investigate the gap, we went back to the Philippine Statistics Authority’s detailed H1 2026 import records. Across the main vehicle categories, the raw customs quantities from china came to roughly 150,000 units, remarkably close to the Chinese export number. But this number needs to filter out units that are not completed vehicles. Some entries related to CKD or assembly-related imports, while others contain quantities that are inconsistent with their reported weight and value.
A customs ‘unit’ does not always equal one finished vehicle.
After excluding explicit CKD/component entries and records with weight discrepancies, our working estimate falls to around 49,000 plausible finished vehicles, which includes 39,000 passenger vehicles. This is much closer to the actual China-built Philippine retail sales. The remaining gap can reflect inventory timing, commercial vehicles outside our passenger-market reconstruction and differences in reporting coverage.
Factory production ≠ domestic retail
Domestic manufacturing needs to be treated the same way, and we can use Toyota Motors Philippines (TMP) 2025 domestic output. TMP reported 63,803 were manufactured in 2025, but our TMS model estimates that 61,500 Philippine-built Toyota vehicles were sold domestically during the year. Neither number is wrong, it’s just that one number measures factory output and another measure sales actually reaching customers.
Customs classifications can vary
Customs classifications do not map perfectly to the way the automotive industry reports sales. Passenger vehicles are captured under the HS 8703 number, while pickups and some commercial vehicles sit under different classifications. This is an important detail because exporting countries can have very different vehicles mixes. Thailand is an example where it has substantial exposure to pickups, meaning passenger vehicle data at customs would understate its important role in the passenger vehicle market.
Export data is therefore best understood as a signal and validation tool, not as a direct substitute for retail sales. The china example demonstrates this well with a headline figure of 149,000 exports can sit alongside only around 40,000 China-built vehicles actually sold.
Methodology: we reconstructed the market from the bottom up
What we wanted to figure out how many Philippine vehicle sales were built in each manufacturing country.
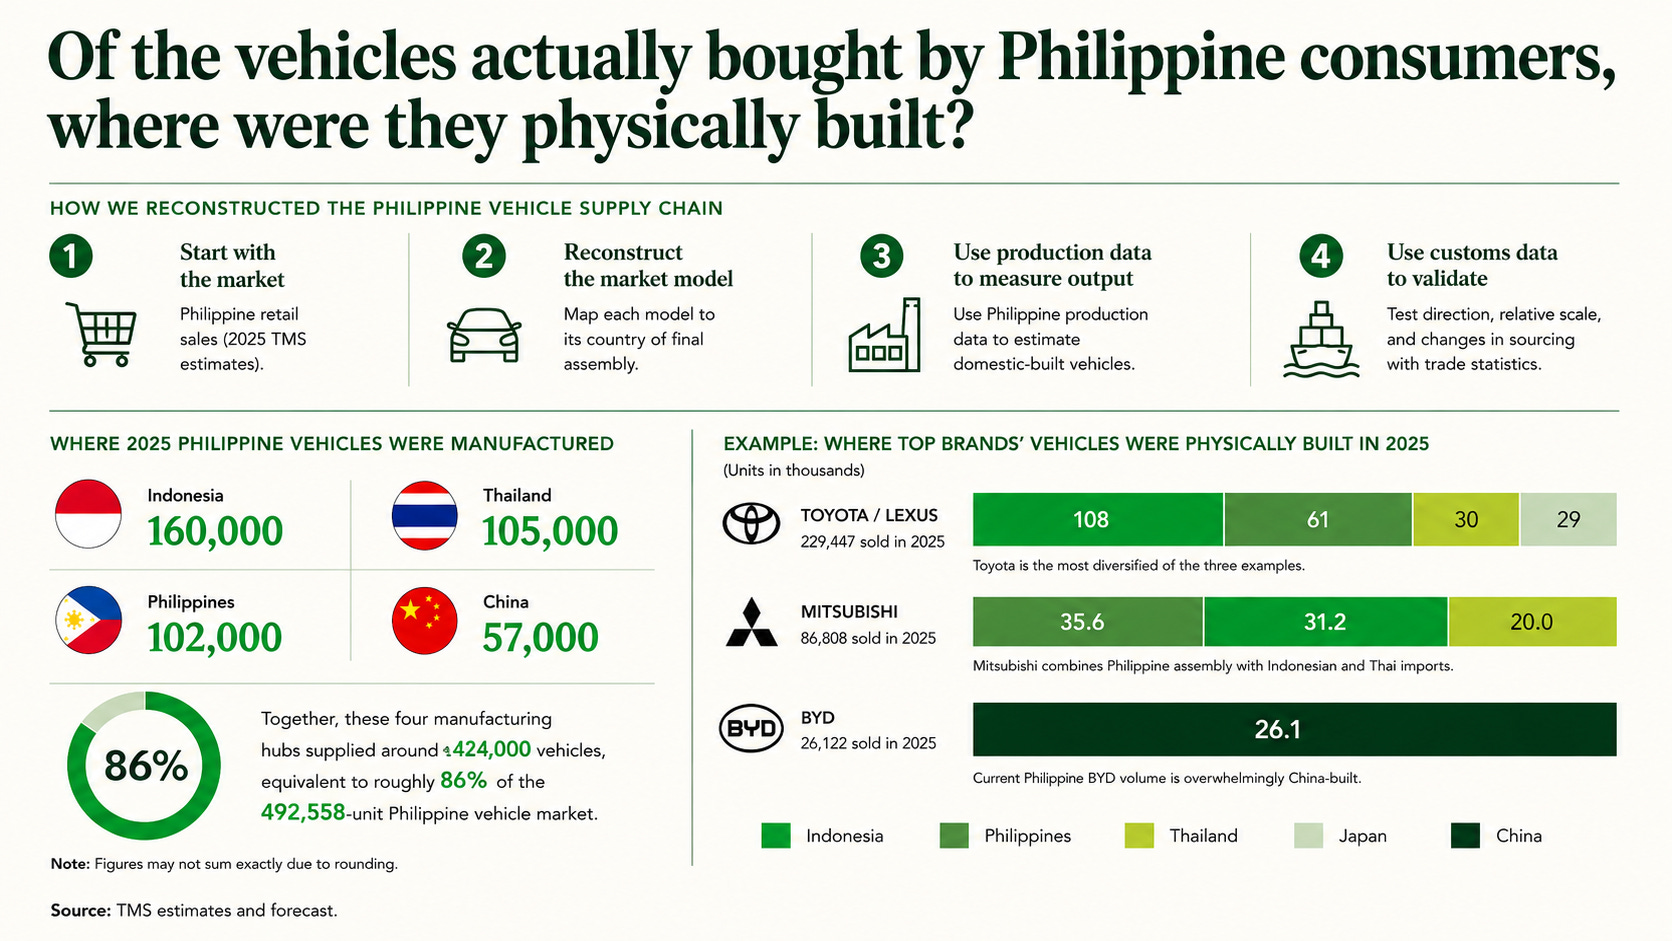
We used a four-step approach;
1. Establish total Philippine retail sell-through
For 2025, TMS estimates 492,558 vehicles were sold in the Philippines, consolidating reported sales from CAMPI, TMA, PADA and independent distributors. That total becomes the control number that our manufacturing-origin estimates ultimately need to reconcile back to.
2. Map individual models to their country of final assembly
We then worked through the market model by model, assigning major nameplates to their manufacturing country. This is important because the brand does not tell us where it is made. Ford is a good example, where the majority of it’s Southeast Asia vehicles come from Thailand, but the Ford Territory comes from China.
Toyota & Lexus, show why this exercise is useful, which sold 230,000 vehicles in the Philippines in 2025, but only a small portion of those vehicles came from Japan.
Based on model-level sales and known production locations, we estimate approximately:
108,000 were built in Indonesia
61,000 were built in the Philippines
30,000 were built in Thailand
29,000 were built in Japan
Toyota is a Japanese company, but the vehicles it sells in the Philippines are supplied through a much broader Asian manufacturing network.
Indonesian supplies high-volume models such as the Avanza, Veloz, Fortuner and Yaris Cross, while the Vios, Innova and Tamaraw are built locally. Thailand supplies models including the Hilux, while Japan accounts for a smaller share of Philippine volume.
Mitsubishi follows a similar regional pattern, its Philippine-built Mirage, Mirage G4 and L300 sit alongside Indonesian-built models such as the Xpander, Xforce and Destinator, while the Triton and Montero Sport are sourced from Thailand.
BYD sits at the opposite end of the spectrum, with its Philippine sales currently far more concentrated around China.
These examples show why looking only at brand nationality can be misleading. Toyota, Mitsubishi and BYD may compete in the same Philippine market, but the manufacturing networks sitting behind them are very different.
3. Reconcile production, imports and retail sales
Once we had mapped models to their manufacturing locations, we compared those estimates with factory production and import activity. Each dataset represents a different stage in the supply chain:
Factory production → vehicle movement / imports → distributor inventory → retail sale
We therefore do not expect production, customs and retail figures to match perfectly within the same calendar year. Instead, production data help us establish whether the amount of locally manufactured vehicles in our model is plausible, while customs flows help us understand the scale and direction of imported supply.
4. Use customs statistics as a cross-check
Finally, we compare our reconstructed retail-origin series with international trade data. Customs data are valuable because they provide an independent view of where vehicle supply is coming from.
If our model says Indonesia is the Philippines’ largest foreign manufacturing source, for example, we should also expect Indonesia to feature prominently in Philippine vehicle-import statistics.
The same logic applies to Thailand and China.
But as we showed earlier, customs quantities need to be interpreted carefully, as vehicle classifications differ, inventory creates timing gaps and not every reported customs unit necessarily represents one complete retail-ready vehicle.
So we use trade data to test direction, relative scale and changes in sourcing, rather than simply substituting customs numbers for sales.
The result is a manufacturing-origin view of the Philippine market that conventional sales rankings cannot provide.
It tells us not only which brands Filipinos are buying, but also which manufacturing economies are actually supplying those vehicles. When we reconstruct the market this way, one finding immediately stands out: despite the Philippines having more than 40 automotive brands and hundreds of models, the physical supply chain is remarkably concentrated.
Four manufacturing hubs now dominate Philippine vehicle supply
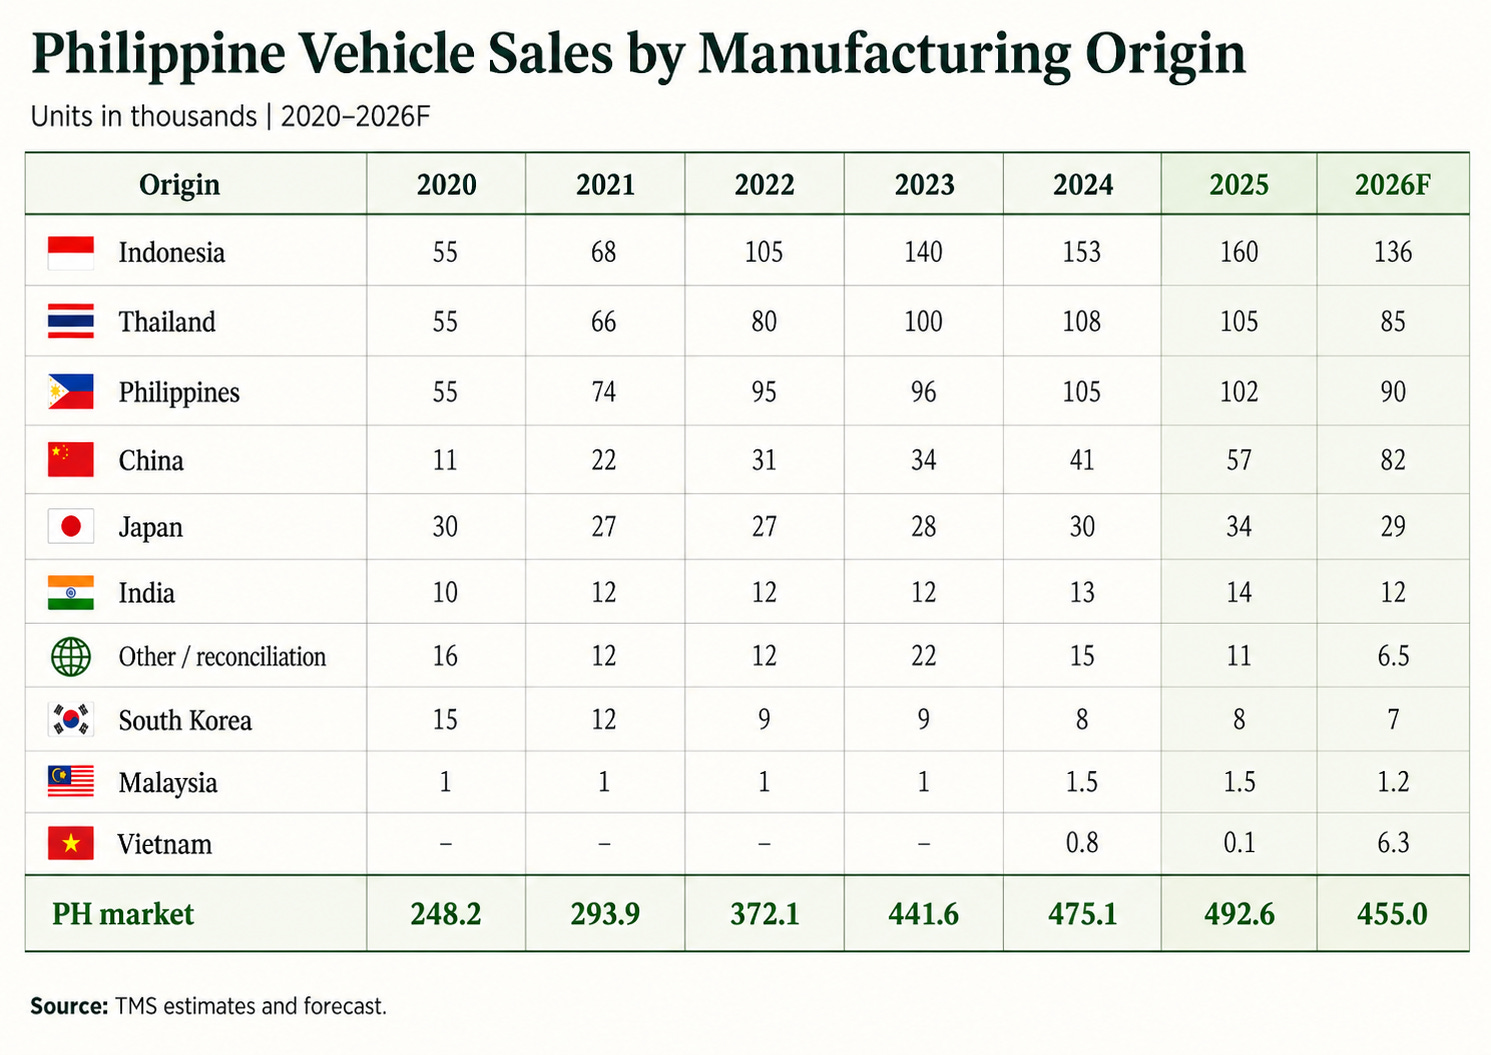
There are now four clear manufacturing hubs supplying the Philippine vehicle market: Indonesia, Thailand, the Philippines and China, representing 424,000 vehicles in 2025, equivalent to roughly 86% of the market. That level of concentration is quite striking when you consider more than 40 brands and hundreds of models compete in the Philippines.
What is changing is not the concentration of Philippine vehicle supply, but the balance of power inside the group.
Indonesia remains the largest manufacturing source by a considerable margin, while Thailand and domestic Philippine production still account for roughly one-fifth of the market each.
China, however, is closing the gap quickly.
Our 2026 base case still has the same four hubs supplying around 86% of the market, but the relative positions become much tighter: Indonesia remains first at around 136,000 vehicles, while Philippine production falls to roughly 90,000, Thailand to 85,000, and China rises to around 82,000.
Indonesia leads today, but the regional balance is shifting
With around 160,000 vehicles sold in the Philippines originating from Indonesia, it was the clear leader in 2025. The reason for that is that it manufactures MPVs, crossovers & SUVs like the Avanza, Veloz, Yaris Cross, Zenix and the Xpander, Xforce and Destinator, which Filipino buyers have been moving towards as their everyday passenger vehicle.
Thailand has traditionally been strong in the pickup and pickup based SUVs such as the Hilux, Ranger, Everest, Triton, Montero Sport, Navara and D-Max. That made Thailand a strong manufacturing hub over the last five years, but that changed last year when excise taxes knocked some of the momentum out of the pick-up market, which we expect to continue into 2026.
Philippine production remains important at around 102,000 vehicles in 2025, but local output is concentrated around a relatively small number of predominately ICE models, which could leave it exposed as the market electrifies.
China is now the fastest growth hub supplying the Philippines
In 2020, we estimate that only around 11,000 China-built vehicles were sold in the Philippines, by 2025 it increased to 57,000 and our 2026 base case is approximately 82,000. That makes the 2026 forecast even more substantial as the overall Philippine market is expected to contract, while China-built vehicles continue to gain market share.
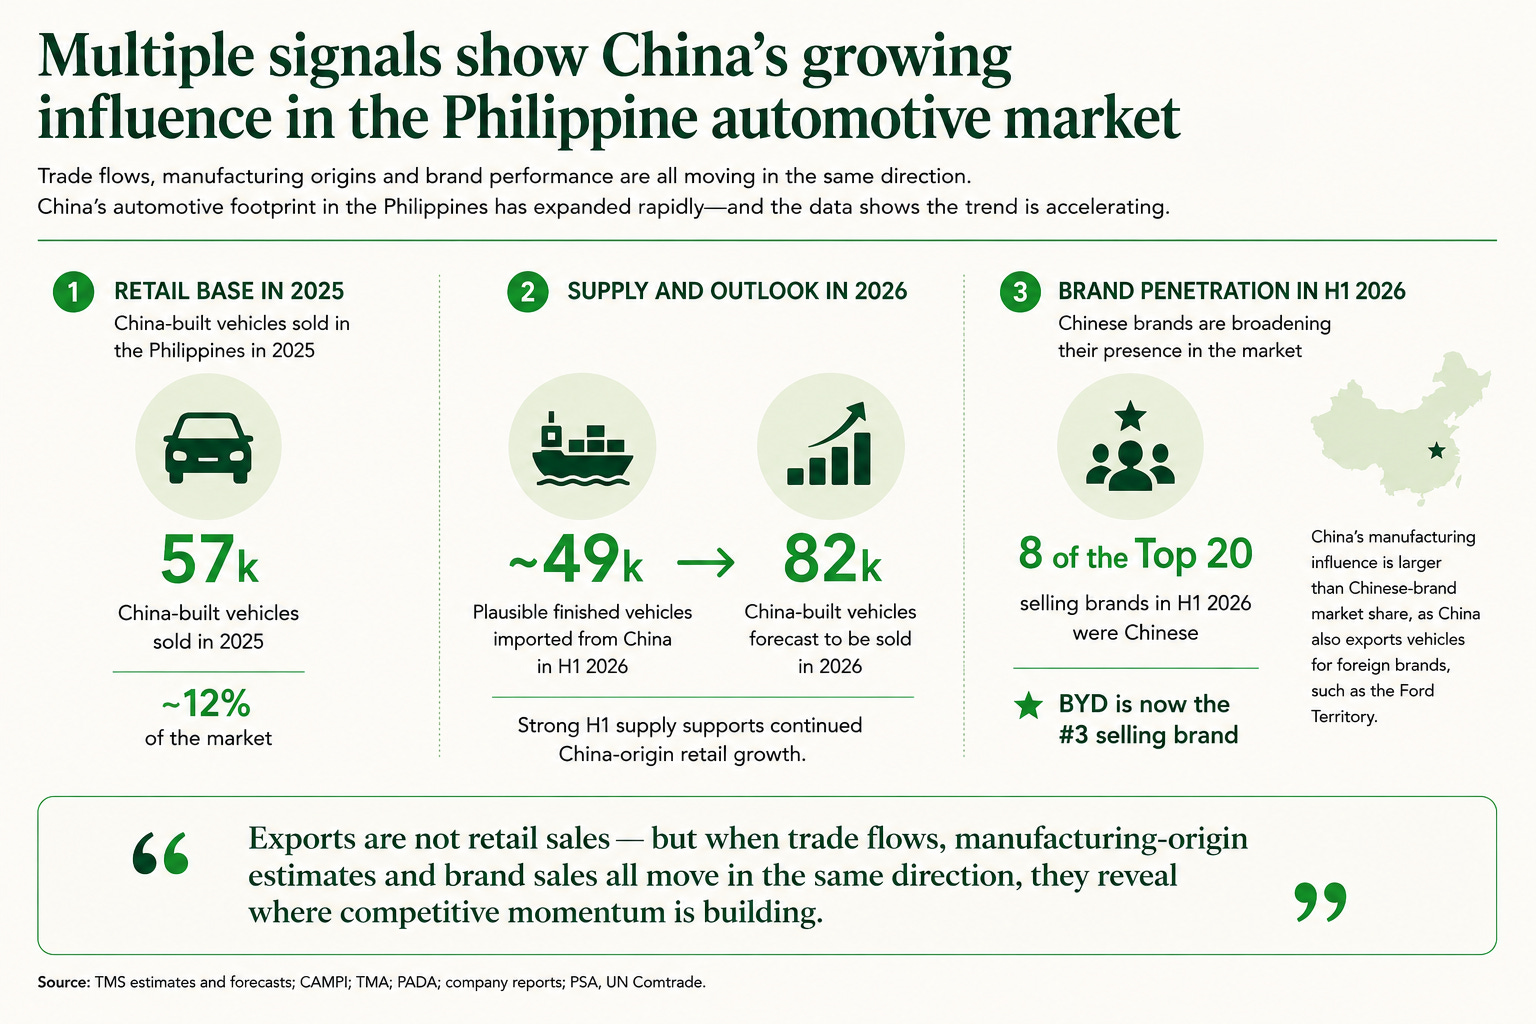
The trend becomes even more convincing when we look at it from three different angles; trade flows, manufacturing share and brand penetration.
Trade flows
Even though imports are not sales, it’s difficult to ignore the scale of H1 2026 supply flow. After removing CKD/component entries and records that didn’t appear to represent complete vehicles, we estimate that around 49,000 plausible finished vehicles arrived from China in the first 6 months alone. That H1 supply figure alone is already approaching the 57,000 China-built vehicles we estimate were sold during the whole of 2025, although the two measures are not directly comparable.
Manufacturing share
China-built vehicles accounted for around 12% of the Philippine market in 2025, and our 2026 forecast puts that number at around 18%, bringing China to a similar scale as Thailand and Philippine domestic production. That’s quite a change over just a 6 year period, and suggests China is moving into the top tier of manufacturing hubs supplying the Philippines.
Brand penetration
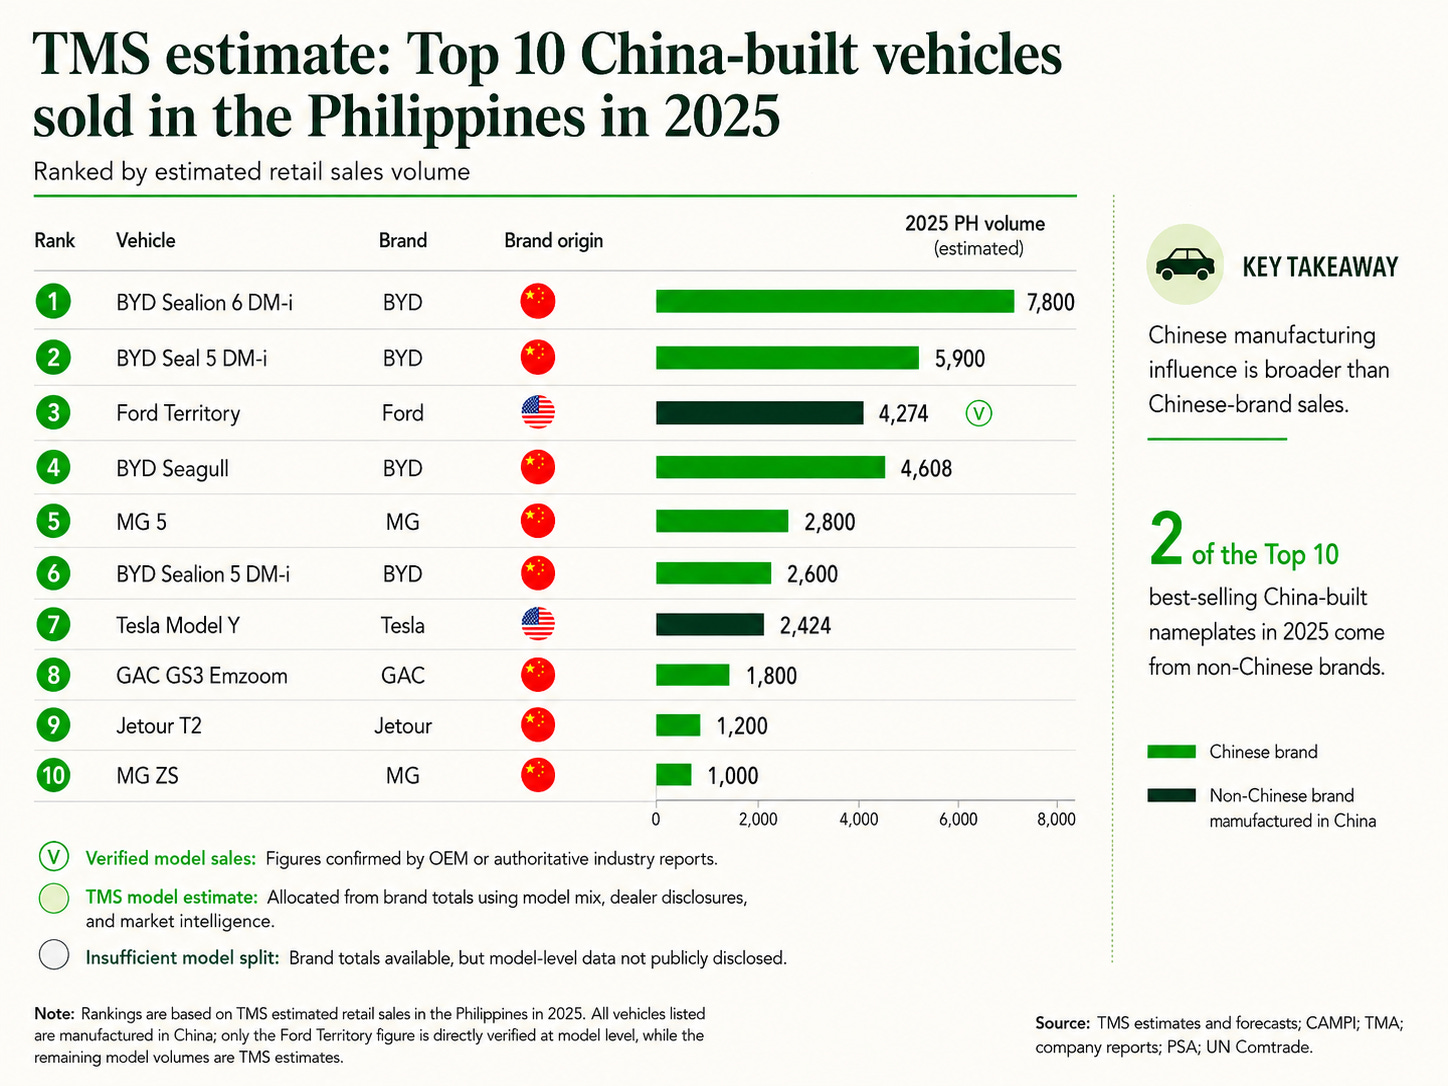
In H1 2026 , 8 of the top 20 selling brands were Chinese, while BYD moved firmly into third place behind Toyota & Mitsubishi and became the leading brand in the electrified vehicle segment. This isn’t just Chinese brands either, as Fords top selling vehicle in H1 2026 was the Chinese-built Ford Territory, showing that China’s manufacturing influence extends beyond Chinese-owned brands.
Japan’s role is changing, not disappearing
Japanese brands still dominate Philippine vehicle sales, but their manufacturing footprint is now deeply regional.
Toyota sources Philippine-market vehicles from Indonesia, the Philippines, Thailand and Japan, while Mitsubishi relies on a similar regional network across the Philippines, Indonesia and Thailand.
So Japan’s influence has not disappeared, but evolved over the decades.
Japanese manufacturers still control much of the market through brand ownership, engineering, product development, technology and investment, but the physical production of those vehicles increasingly happens elsewhere in ASEAN.
That distinction matters because it changes how we think about automotive influence.
Brand ownership and manufacturing geography are increasingly two different maps.
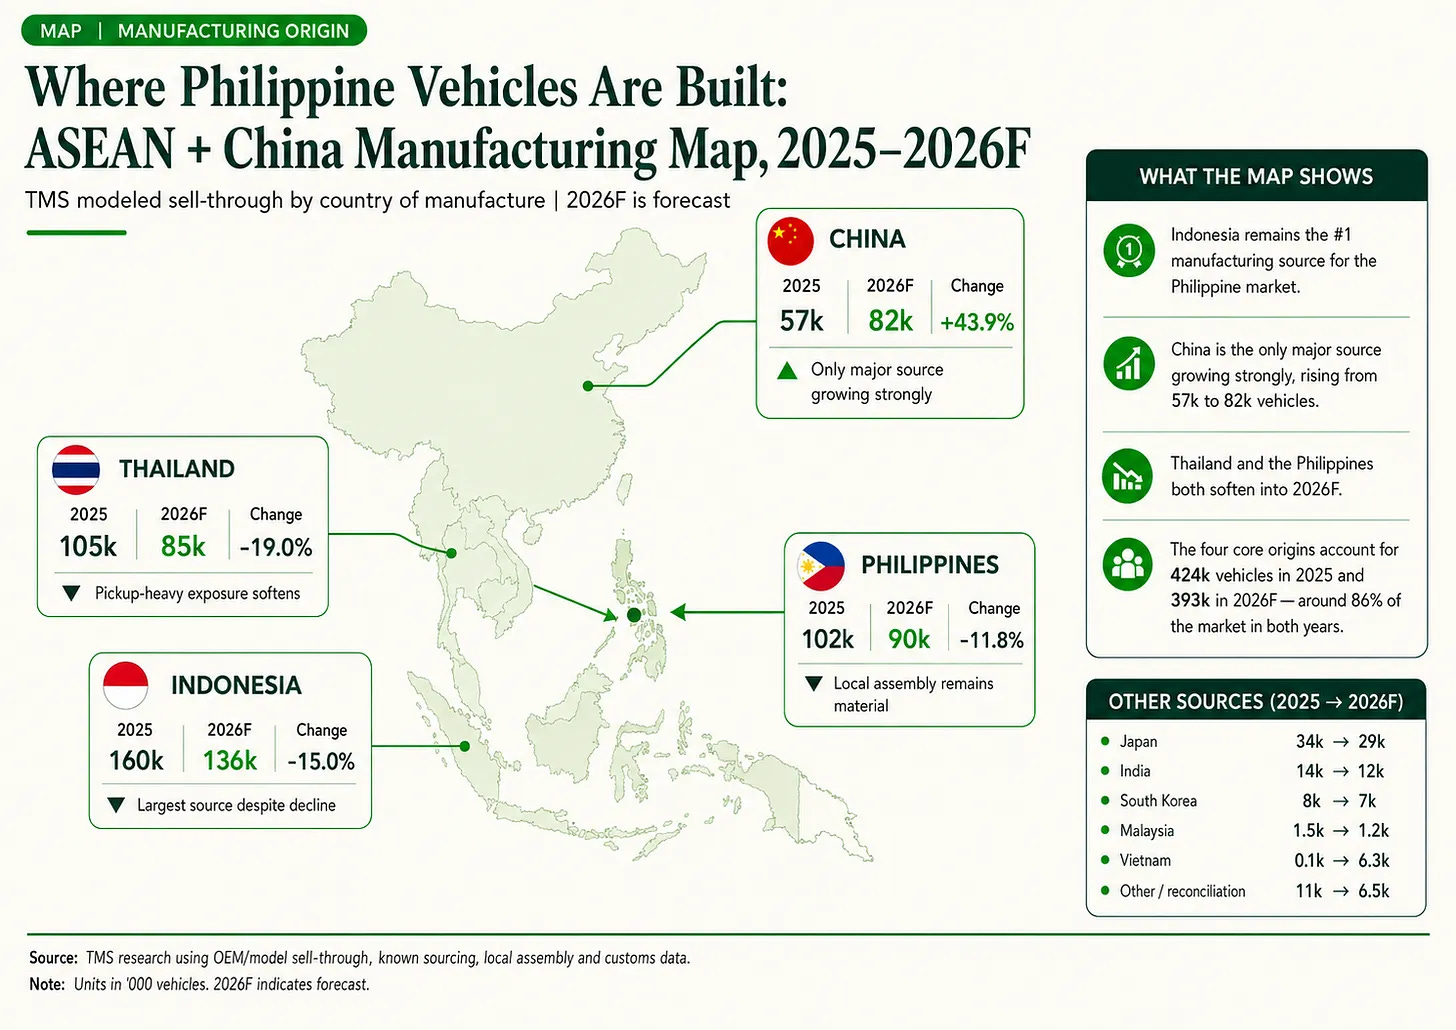
The Philippine market remains dependent on a small group of manufacturing hubs, but the mix within that group is starting to change.
The next phase of the market, which we are entering now, will be shaped not just by which brands gain market share, but by which countries are best positioned to manufacture Hybrids and BEVs that Filipinos want, at the right price.
Electrification is not simply changing what powers the vehicle, it is beginning to change which factories and countries supply the Philippine market.
Can the Philippines strengthen its position in the next manufacturing phase?
The Philippines also needs to move towards electrification, or its manufacturing hub position could weaken over time.
This is where Mitsubishi Philippines has stepped up, committing around P7 Billion to manufacture hybrid vehicles at its Laguna plant, with an expected production start date in 2028.
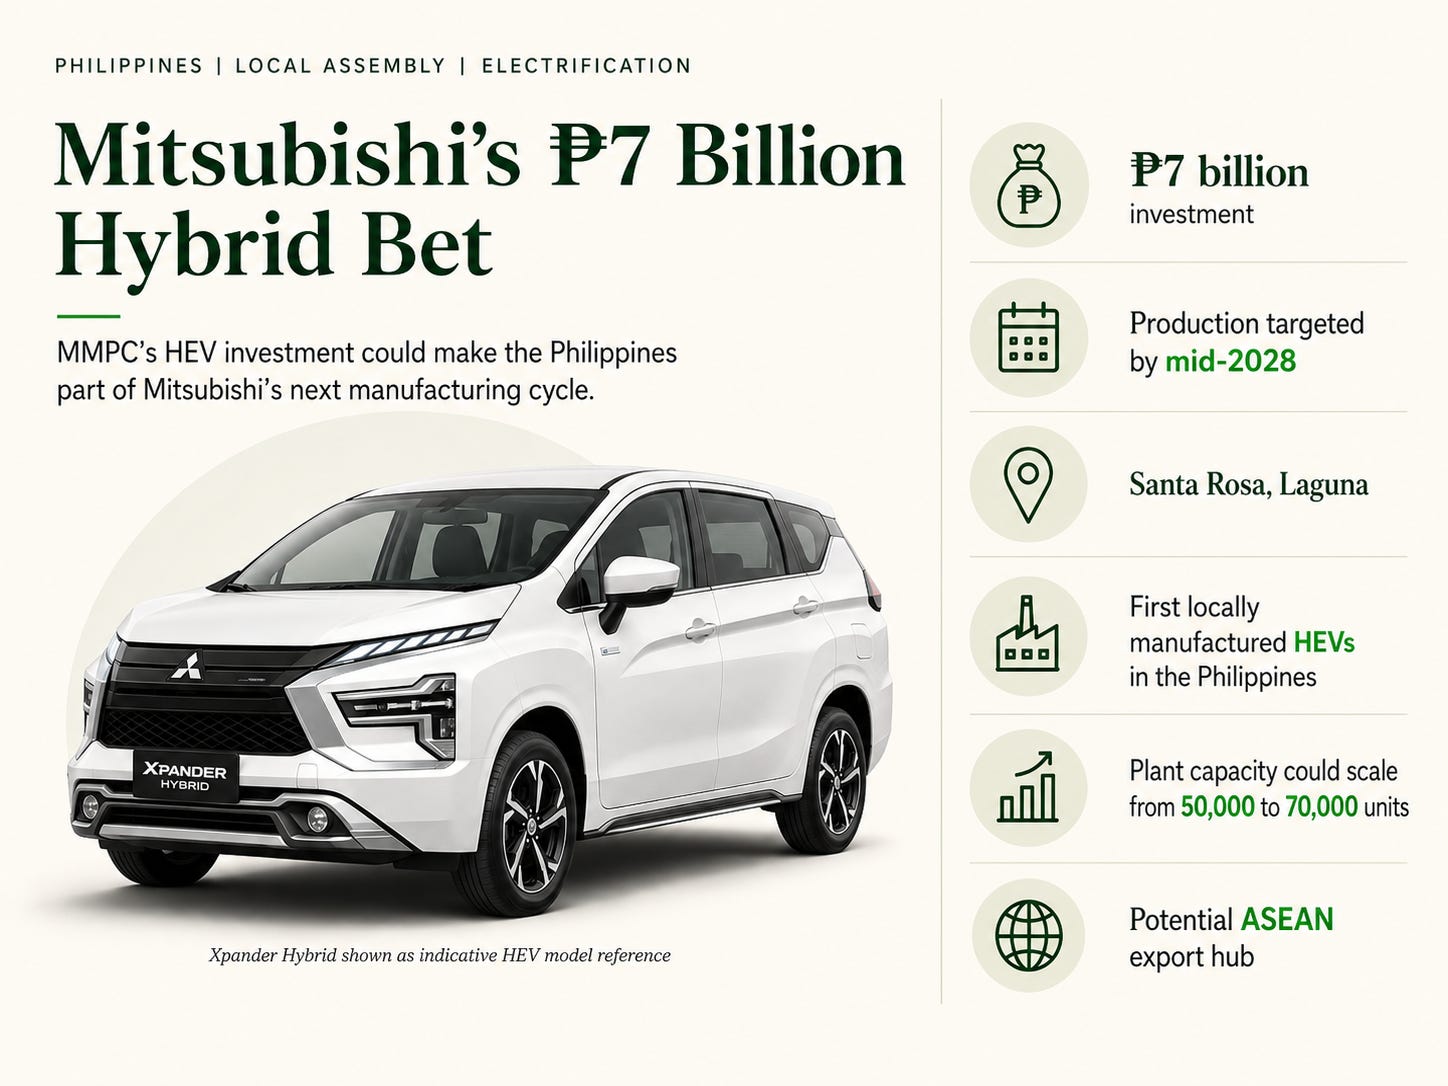
This investment is significant, not only to Mitsubishi but for the local automotive supply chain. Mitsubishi has discussed local battery-pack assembly and the potential for the Philippines to become an export base for other Southeast Asia markets, which will be supported by the government’s new Electric Vehicle Incentive Strategy (EVIS). This is an important step in shifting the direction of the local manufacturing industry and could create new opportunities in the new shift to NEV production.
Conclusion: Different types of demand are reshaping the supply chain
We began this analysis by asking what vehicle export data could tell us about what Filipinos are actually buying. What we found is that exports alone can’t directly answer that question. Exports, factory production and retail sales all measure different stages of the supply chain, and as we found with the China data, numbers can look very different and need interpretation.
But when we combine all three; trade flows, model-level sales and known manufacturing locations, a much clearer picture emerges.
Indonesia’s rise over the past fiver years has benefited from growing demand for MPVs and crossovers. Thailand’s pickup heavy supply base is weakening as demand softens and tax treatment changes. China is growing rapidly alongside electrification and new Chinese brands, while the Philippines stands at a crossroads, between its existing ICE production base and the opportunity to participate in the next generation of electrified production.
So this is becoming more than brand versus brand, but competition between manufacturing ecosystems, and as electrification changes what Filipinos are buying, it begins to change where those vehicles sold in the Philippines are actually built.